Download

1 / 44
460 likes | 646 Views
MM IPMI. INTERNATIONAL FINANCE LECTURE NOTES. Prof. Roy Sembel, Ph.D October 2009 – February 2010. January 9 AGENDA. Review of course outline, assignments, and last-week materials Exchange rate forecasting Fundamental & Technical Analysis Efficient Market Theory

E N D
MM IPMI INTERNATIONAL FINANCE LECTURE NOTES Prof. Roy Sembel, Ph.D October 2009 – February 2010
January 9 AGENDA Review of course outline, assignments, and last-week materials Exchange rate forecasting Fundamental & Technical Analysis Efficient Market Theory Simulation: 5 minute presentation on temporary results
December 19 AGENDA Review of course outline and assignments International arbitrage: Locational, triangular, interest arbitrage Interest rate parity Purchasing power parity International Fisher Effect Case: Whaler Publishing Company (p. 657) Simulation: 5 minute presentation on temporary results Guest Lecturer: GCG
STUDENT CENTERED APPROACH ‘Students’ Active learners: • Read reading materials • Discuss within group (articles, hot issues, investment simulation, solution for cases, book review, preparing presentation) • Participate actively in class discussion ‘Lecturer’ Facilitator: • Structure syllabus • Prepare reading materials, cases, simulation rules & template • Invite guest lecturers • Facilitate discussion, presentation 3-stage learning: • Individual learning • Group discussion • Class discussion Grading policy: • Individual efforts (class participation & quiz) 35% • Group efforts (case summary & group presentation) 40% • Final examination 25%
COURSE OUTLINE Projects / Cases: • Event analysis: (Financial) Crises of the world • International Portfolio Investment Simulation • Book Review • Analysis of one Multi National Company (MNC) • Exchange rate forecasting Final Examination
Project 1: Crises of the world • Oct 10 Choose one of the crises: Indonesia 1966, Indonesia 1997, Sub-prime mortgage 2007, Jerome Kerviel (Societe Generale 2007), DotCom Bubble 2000, The Great Depression 1929 • Nov 14 1-page description of the crises • Nov 28 Analysis of the causes of the crises • Dec 19 What happened after the crises • Jan 23 Lessons learned from the crises • Jan 30 Submit complete report • February 625-minute presentation of the crises
Project 2: SimulationInternational Portfolio Investment • Nov 14 5-minute presentation of criteria, reasons, and fund allocation • Nov 28 – Jan 30 weekly performance report • February 6 5-minute presentation of final results and lessons learned
Project 3: Book Review • Nov 14 Choose one book • Jan 9 Submit Report (10 pages, A4, times roman 12, line spacing1.5) • Jan 16 Book review presentation
Project 4: Analysis of one Multi National Company (MNC) • Oct 10 Choose one MNC • Nov 14 Describe briefly the MNC • Nov 28 Analyze historical (weekly: last 52 weeks, yearly: last 5 years) performance of MNC’s stock • Dec 19 Analyze MNC’s funding and investment strategy • Jan 30 Analyze MNC’s financial risk management strategy • Feb 6 Submit complete report on MNC
Project 5: Exchange Rate Forecasting • Nov 14, 2009 to January 9, 2010 Visit www.oanda.com, play around with Rp/$ data (average daily return, volatility, etc), download monthly data January 2007 – January 2010 • January 9, 2010 Forecast the Rp/$ (closing) exchange rates for 11/1, 12/1, 13/1, 14/1, 15/1. • January 16 Record your forecast error
Final Examination • Group take-home examination [40% of total final examination score]: Complete report on Investment simulation, EVENT, MNC • Individual in-class examination [60% of total final examination score]: Questions on projects, hot issues, guest lecture, articles, etc.
Assignment agenda January 9: Readings: Fundamental vs Emotion in Stock Market Project/Case: • Investment Simulation: weekly performance report • Book Review: Submit report (10 pages, A4, times roman 12, line spacing 1,5)
Assignment agenda January 16: Readings: Book review summaries Project/Case: • Book Review: 30 minute presentation per group • Investment Simulation: weekly performance report
Assignment agenda January 23: Readings: ICF Ch 5, 10, 11, 12 Managing Derivatives Risks: Barings Several articles on Risk Management Project/Case: • Case: Vogl Co • EVENT: Lessons learned • Investment Simulation: weekly performance report
Assignment agenda January 30: Readings: ICF Ch 16, 19, Appendix 3 p 87-97 Articles: Emerging Market Risk; Measuring Long Term Performance Project/Case: • EVENT: Submit complete report on the crises • MNC: Financial Risk Management in MNC • Investment Simulation: weekly performance report
Assignment agenda February 6: Project/Case: • EVENT: Complete 25-minute presentation of the crises • Simulation: 5 minute presentation of International Portfolio Investment Simulation Results and Lessons learned • MNC: Complete report on MNC
January 9 AGENDA Review of course outline, assignments, and last-week materials Exchange rate forecasting Fundamental & Technical Analysis Efficient Market Theory Simulation: 5 minute presentation on temporary results
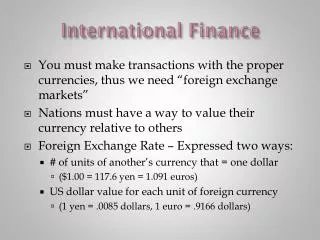
Decide whether to hedge foreign currency cash flows 1QA\ Decide whether to invest in foreign projects Dollar cash flows Forecasting exchange rates 1QA\ Decide whether foreign subsidiaries should remit earnings Value of the firm Decide whether to obtain financing in foreign currencies Cost of capital Corporate Motives for Forecasting Exchange Rates
Forecasting Techniques • Methods for forecasting exchange rates can be categorized into four general groups: 1. Fundamental 2. Technical, 3. Market-based, and 4. Mixed.
Exchange rate: BIG PICTURE Inflation Differential Domestic DEMAND for foreign goods Foreign DEMAND for domestic goods Domestic DEMAND for foreign currency SUPPLY of foreign Currency for sale Income Differential EXCHANGE RATE between the foreign & domestic currency Gov’t Trade Restriction Domestic DEMAND for foreign securities Foreign DEMAND for domestic securities Domestic DEMAND for foreign currency SUPPLY of foreign Currency for sale Interest rate differential Capital flow restriction
Fundamental Forecasting • Based on fundamental relationships between economic variables and exchange rates. • E.g. subjective assessments, quantitative measurements based on regression models and sensitivity analyses. • Limitation of PPP to forecast future exchange rates: PPP may not hold and future inflation rates are also uncertain
Fundamental Forecasting • In general, fundamental forecasting is limited by: • uncertain timing of the impact of the factors, • need to forecast factors that have an immediate impact on exchange rates, • omission of factors that are not easily quantifiable, and • changes in the sensitivity of currency movements to each factor over time.
Technical Forecasting • Use historical data to predict future values • E.g. time series models. • Speculators may find the models useful for predicting day-to-day movements • Typically focus on the near future and rarely provide point or range estimates limited use to MNCs
Video: Technical Analysis • Trend • Support vs Resistance; Channel • Double bottom, Double top • Head and Shoulder, Inverted H & S • Triangle (Symmetric, Ascending, Descending) • Gap (Common, Breakaway, Measuring, Exhaustion)
Market-Based Forecasting • Uses market indicators to develop forecasts. • Current spot/forward rates are often used, since speculators will ensure that the current rates reflect the market expectation of the future exchange rate. • For long-term forecasting, the interest rates on risk-free instruments can be used under conditions of IRP.
Mixed Forecasting • Mixed forecasting refers to the use of a combination of forecasting techniques. • The actual forecast is a weighted average of the various forecasts developed.
Comparison of Forecasting Methods • The different forecasting methods can be evaluated • graphically – by visually comparing the deviations from the perfect forecast line, or • statistically – by computing the forecast errors for all periods.
Forecasting Rp/US$ Group Dates 11 12 13 14 15 comments 1 9250 9250 9250 9250 9250 TA 2 9260 9280 9315 9290 9280 TA 3 9276 9224 9241 9163 9206 TA • 9279 9275 9274 9276 9275 TA (MA-3) • Random walk == Exch Rate on 10
January 9 AGENDA Review of course outline, assignments, and last-week materials Exchange rate forecasting Fundamental & Technical Analysis Efficient Market Theory Simulation: 5 minute presentation on temporary results
Forecasting Under Market Efficiency • If the foreign exchange market is weak-form efficient, then the current exchange rates already reflect historical information. So, technical analysis would not be useful. • If the market is semistrong-form efficient, then all the relevant public information is already reflected in the current exchange rates.
Forecasting Under Market Efficiency • If the market is strong-form efficient, then all the relevant public and private information is already reflected in the current exchange rates. • Foreign exchange markets are generally found to be at least semistrong-form efficient.
Forecasting Under Market Efficiency • Nevertheless, MNCs may still find forecasting worthwhile, since their goal is not to earn speculative profits but to use exchange rate forecasts to implement policies. • In particular, MNCs may need to determine the range of possible exchange rates in order to assess the degree to which their operating performance could be affected.
Exchange Rate Volatility • A more volatile currency has a larger expected forecast error. • MNCs measure and forecast exchange rate volatility so that they can specify a range (confidence interval) around their point estimate forecasts [REMEMBER LAST WEEK CASE: WHALER]
Exchange Rate Volatility • Exchange rate volatility can be forecasted using: • recent (historical) volatility, • a historical time series of volatilities (there may be a pattern in how the exchange rate volatility changes over time), and • the implied standard deviation derived from currency option prices.
CONFIRMATION OF EMH • Performance of Mutual Funds < Market Index • No persistence of Good Performance • The Rise of Index Funds • Above-average Performance • Low costs • VIDEO: Who Needs Experts ?
Market Efficient? • Games: • US$ Forecast • Speed of the response of the market
EFFICIENT MARKET EXPERIMENT GROUP X • Recently, US$ has been fluctuating around Rp 9.250/US$ to • Give your prediction of Rp/US$ at the end of this year (2010) !
EFFICIENT MARKET EXPERIMENT GROUP Y • Recently, US$ has been fluctuating around Rp 9.250/US$ to • Do you believe that US$ will rise to above Rp 10.500/US$ at the end of this year ? • Give your prediction of Rp/US$ at the end of this year (2010) !
EFFICIENT MARKET EXPERIMENT GROUP Z • Recently, US$ has been fluctuating around Rp 9.250/US$ to • Do you believe that US$ will rise to above Rp 8.000/US$ at the end of this year ? • Give your prediction of Rp/US$ at the end of this year (2010) !
IS THE MARKET EFFICIENT ? • According to Eugene Fama • According to Grossman-Stiglitz • According to Fischer Black • According to You ?
January 9 AGENDA Review of course outline, assignments, and last-week materials Exchange rate forecasting Fundamental & Technical Analysis Efficient Market Theory Simulation: 5 minute presentation on temporary results
Investment Simulation Results Group Portfolio value Main contributor 19/12 9/1 1 105,4 106,3 Mexico, Indonesia 2 100,8 102,1 South Kor, Hong Kong 3 97,9 100,4 China, Indonesia 4 101,2 103,1 Indonesia, DJIA
Assignment agenda January 16: Readings: Book review summaries Project/Case: • Book Review: 30 minute presentation per group • Investment Simulation: weekly performance report