Download
1 / 31
310 likes | 330 Views
This text explores the risks associated with climatic change and suggests possible responses. It discusses changes in temperature, extreme weather events, land degradation, melting ice, economic and political impacts, and social effects. It also examines the uncertainties in predicting future climate patterns and highlights the potential effects of global warming on various aspects such as soil degradation, water utilization, undernutrition, and ocean currents. Additionally, it outlines the possible impacts of global warming on the atmosphere and hydrosphere at a national scale and discusses the need for management plans to cope with these changes. Finally, it presents the responses to climatic change, such as social, political, technological, and ecological measures, including recycling and conservation.

E N D
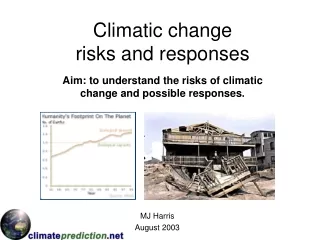
Climatic changerisks and responses Aim: to understand the risks of climatic change and possible responses. MJ Harris August 2003
Outline the differences between renewable and non-renewable resources. Explain the term “potentially renewable”.
Climatic change - possible risks • Changes in temperature, precipitation, seasonality, climatic belts • Greater frequency of extreme weather events e.g. floods, droughts, gales, hurricanes, tornadoes • Oceanic e.g. circulations, ecology • Land degradation e.g. soil erosion, landslides • Melting ice e.g. sea-level change, tourism • Economic e.g. food, production, communication • Political e.g. competition for land and resources • Social e.g. health
How certain are the predictions? There is uncertainty in the basic prediction 'what is the temperature going to do over the next 100 years'. Given this uncertainty it is even harder to say what might happen to secondary features.
Global temperatures by 2050 The map shows projected change in annual temperatures for the 2050’s compared to present day, when the climate model is driven by an increase in greenhouse gas concentrations equivalent to about a 1% increase per year in CO2 levels (source Hadley Centre). Suggest what problems could result from these predicted changes.
Simplified model of possible future world climate and weather extremes Normal current weather Normal future weather R ed = Current conditions How often? Blue= Possible future conditions Extreme weather Extreme weather Weather events The graph shows that global climatic change could not only lead to a change in “normal” weather but also to a change in weather extremes. It is not possible to directly attribute a single extreme weather event (hurricane, flood, drought) to global climatic change. However global warming could lead to more frequent extreme weather events.
Find recent examples of extreme weather events … Has there been a measurable increase in extreme weather events in the last 20 years? If so, can this be directly attributed to global climatic change?
Human induced soil degradation How might possible global climatic change affect the pattern, type and rate of soil degradation? (Source FAO)
Water utilisation intensity Which parts of the world could be particularly vulnerable if global climatic change leads to less rainfall (Source FAO)
Chronic undernutrition Why does chronic undernutrition affect certain countries? How is the situation predicted to change by 2010? (Source FAO)
Disruption to ocean currents What is the Gulf Stream? Why is it so important for people living on the east coast of the USA and in Western Europe?
Warm, salty surface water is chilled and sinks in the North Atlantic to flow south towards Antarctica. There, it is cooled further to flow outward at the bottom of the oceans into the Atlantic, Indian, and Pacific basins. After upwelling the water returns as surface flow to the North Atlantic. While travelling deep in the ocean the originally nutrient-depleted water becomes increasingly enriched by organic matter and dissolved CO2 • What is the thermohaline conveyor? • Why is it important? • Why may it be disrupted by global climatic change?
Possible effects of global warming as predicted by the IPCC Make a list of the possible effects of global warming using the following sub-headings: physical, human, economic.
Possible impacts on atmosphere and hydrosphere • The diagram shows changes (identified by the IPCC) in atmospheric and hydrological characteristics resulting from global warming • What changes have been identified in the following: • Ocean temperature • Sea-level rise • Cloud type and amount • Snow cover • CO2 levels
Possible climatic impacts at anational scale • The map shows possible weather changes in the UK by the year 2080 • What impact could these predicted changes have in the following areas: • South-East England • Coastal areas • Consider some of the positive and negative impacts • What management plans may be needed to cope with these possible impacts.
The maps show a forecast for the flow of Gulf Oil supplies in 2010. Outline the possible risks of this pattern of oil production and distribution.
Climatic change - responses • Social e.g. education, conservation, recycling • Political e.g. international protocols, legislation • Technological e.g. renewable energy • Ecological e.g. tree planting
Recycling and conservation • what materials do you recycle? • How does this help reduce levels of CO2? • What else could you do to increase the amount of recycling? • How else can energy be conserved?
Transport Transport uses 95% of world oilHow many cars are there in your household?How do you travel to work? To shop? To school?
Industrialised countries produce most CO2 Comment on the situation in 1990. What is proposed to ensure a sustainable future?
The fossil fuel era…. And now for the future ……….?
Alternatives? • What are the possible problems of relying on fossil fuels? • List some alternative/renewable sources of energy. • Why are these not currently contributing a great deal to overall energy production? • What could be done to increase the use of alternative sources?
Kyoto Protocol 1997 In an accord reached at a United Nations meeting in Kyoto, Japan, in December 1997, 84 countries agreed on the need for an average 5.2 per cent reduction in industrialized countries’ 1990 emissions by the year 2012, to slow global warming due to the greenhouse effect. The reductions are not the same for all countries but depend on the degree of economic development, population, climate and size. Canada committed to cut its 1990 emissions by 6 per cent, Britain by 12.5 per cent, Germany by 21 per cent and the United States by 7 per cent. Developing countries face no immediate reduction target. The Protocol will become international law when governments representing 55 countries emitting 55 per cent of the industrialized world’s emissions ratify it. The Kyoto Protocol’s guiding principles are economic efficiency, environmental integrity and support for sustainable development. • How else could countries be encouraged to reduce their output of CO2?
Political action? Inaction? Comment on the situation shown above….
Kyoto protocol - who has ratified? http://www.worldpolicy.org/globalrights/environment/maps-Kyoto.html • Describe the maps • Why have some countries refused to ratify the Kyoto protocol?
Technological solutions • How can technology help to reduce the level of CO2 emissions? • Why is such technology not used more widely?
Ecological solutions • Three actions to reduce global warming • * Use fossil fuels more efficiently • * Save old-growth forests, cut sustainably • * Plant trees when you travel • * 1 tree every 2,000 miles (3200 km) by car • * 1 tree every 1300 miles (2000 km) by plane • * 1 tree every 100 gallons (375 litres) of gasoline • 1 tree every 1000 kilowatt-hours • (one kwhr ~= 1.9 pounds CO2) • How could tree planting help to reduce the level of atmospheric CO2?
World forest cover Which parts of the world have i) the greatest and ii) the lowest proportion of forest cover as % of total land area? Comment on the annual change in forest cover.
Find out more? • BBC weather • climateprediction.net • DEFRA • Earthlink.net • Environment.about.com • Global cooling • UNEP • World Food Summit 1997