Download
1 / 35
350 likes | 367 Views
Explore the progress, findings, and future prospects of the LAMOST spectroscopic survey, from construction to regular survey operations. Discover insights into stellar parameters, galaxy structure, and collaborations in the scientific community.

E N D
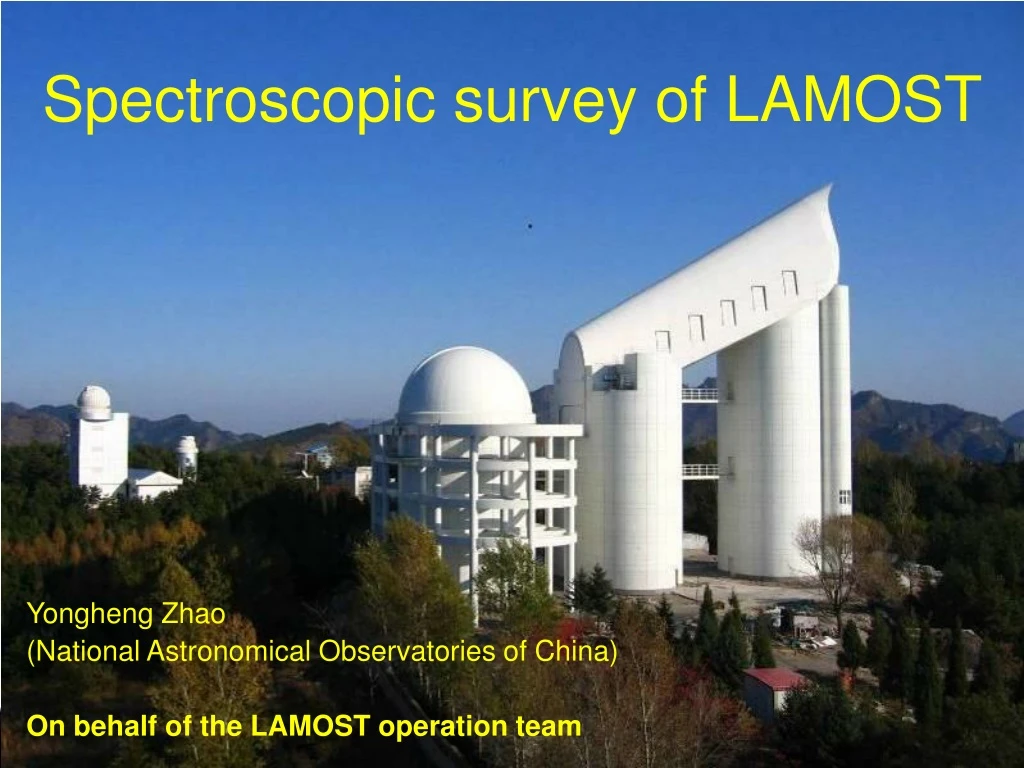
Spectroscopic survey of LAMOST Yongheng Zhao (National Astronomical Observatories of China) On behalf of the LAMOST operation team
Outline • LAMOST • Spectroscopic Survey of LAMOST • Spectra & stellar parameters • LAMOST Sciences • Summary
1997-2008: Construction 2009 – 2011: Commissioning Oct. 2011 – June 2012: Pilot survey Sep. 2012 – June 2017: Regular survey
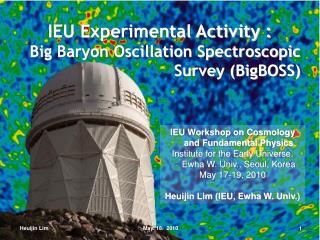
Commissioning stage June 2009 – Sep. 2011 2/3 slit (R=1800) Progress in fiber positioning Realistic survey limiting magnitude: r = 17.8 Scientific test observations M31 area Planetary nebulae Kinematics + populations Quasars beyond Quasars Metal-poor stars
Emission line galaxy r=19.90 z=0.06 Emission line galaxy r=19.90 z=0.09 Quasar r=19.14 z=2.40 K3 star r=19.40 WD star r=18.18
LAMOST Survey Pilot Survey 2011.10-2012.6 PDR: 2012.8 Regular survey 1st year: 2012.9-2013.6 DR1 (2013.9) 2nd year: 2013.9-2014.6 DR2 (2014.12) 3rd year: 2014.9-2015.6 pilot 1st year 2nd year
Spectral data 1 M spectra / year
Stellar parameters(2,165,200spectra in DR2) Exceeding the total number of currently known database; Largest stellar parameter catalogue so far
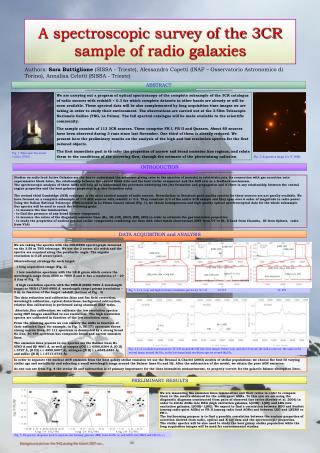
LAMOST光谱巡天进展 Footprint of 455 million spectra of SNRs > 10 collected by 2015.06
质量控制 光谱数达标率(SNRs > 10) 先导巡天(2011—2012 ) 573,227 48.4% 常规巡天第一年(2012—2013) 1,243,478 62.7% 常规巡天第二年(2013—2014) 1,326,700 72.4% 常规巡天第三年(2014—2015) 1,304,925 71.8% 反银心方向巡天B、M面板观测源和达标源星等分布比较 常规巡天第3年(2014—2015) 常规巡天第一年(2012—2013) 常规巡天第二年(2013—2014)
2D pipeline: sky subtraction • Comparison with SDSS: • Better in red band for same S/N 760 and 860 nm where large number of sky emission lines
Flux calibration: spectral accuracy Green solid line: median Green dashed lines: std.dev Red solid lines: examples Comparisons of multi-observations as well as with photometry show the final SEDs have an accuracy better than 12%. Xiang et al. 2014a, to be submitted
Comparison of LAMOST and SDSS spectra Low-extinction regions High-extinction regions Black: LAMOST Red: SDSS DR7 Our approach of flux calibration yields better, more realistic SEDs than SDSS for high extinction fields.
Comparison with external data: Teff, log g, [Fe/H] Teff, log g and [Fe/H] are accurate to ~ 150 K, ~ 0.25 dex, 0.15 dex for FGK stars, respectively. The results of SDSS DR9 are systematically −105 K, 0.24 dex, 0.12 dex lower. Xiang et al. 2014b, to be submitted
Scientific papers • 48 scientific papers published • 38 under processing Papers with SDSS spectral data Papers with LAMOST data PDR DR1
White dwarf mass function & birth rate Rebassa Mansergas et al. in prep.
Binary fraction in field FGK stars Gao et al., 2014 ApJLetter Yuan et al., to be submitted
Based on 66,647 thin disk FGK dwarfs (4200 < Teff < 6800 K, 3.8 < log g < 5.0, e < 0.15) within 600 pc of the Sun. The largest sample hitherto confirms that VΘ~12km/s. Results from different sub-populations suggest that the local disk is well relaxed The Local Standard of Rest Huang et al., 2014a to be submitted
Bulk motions of disk stars Carlin et al., 2013, ApJL
Metallicity Gradients of the Galaxy The outer disc shows both radial & vertical metallicity gradients. The radial gradient flattens at |Z| > 1.1 kpc, and so does radial gradient at R > 10 kpc Xiang et al. 2014c, Gong et al. 2014, to be submitted
Collaboration with Kepler project • 62,381 spectra observed 32,462 Kepler stars
LAMOST Sciences Proposed Extra-galactic spectroscopic survey Galaxy & QSO redshift survey Stellar spectroscopic survey Structure of the Galaxy & stellar physics Cross identification of multi-waveband survey Present (2/3 slits:R = 500 1800) Galactic survey Structure & evolution of the Galaxy QSO & galaxy Cross identification of multi-waveband survey
Galactic survey(2012-2017) The Milky Way is the only grand-design barred spiral (disk) galaxy that the individual stars can be resolved and studied multi-dimensionally ( 6D phase space + chemical composition).
Stellar halo profile Xu et al. in prep.
Local dark matter density
The survey will deliver classification, Vr, Teff, log g, [Fe/H], [α/Fe] for ~5 millions of stars. A magnitude-limited and (statistically) complete sample of ~3 M stars Distributed in a contiguous area Sampling a significant volume of the thin/thick disks and halo With GAIA data, yield a unique dataset to Study the stellar populations, chemical composition, kinematics and structure of the thin/thick disks and halo Identify tidal streams & debris of disrupted dwarfs and clusters Probe the gravitational potential and dark matter distribution Map the interstellar extinction as a function of distance Search for rare objects (e.g. stars of peculiar chemical composition or of hyper-velocities) Ultimately advance our understanding of the assemblagehistory of the Milky Way,and of galaxies in general and their regularity and diversity. Scientific goals of the galactic survey
Data policy of LAMOST • Internal release • Chinese astronomers • International collaborators (with Chinese groups) • DR1 (2013.09) : 1.8M spectra/1.0M parameters • DR2 (2014.12): 3.0M spectra / 2.1 M parameters • DR3 (2015.12): 4.5 M spectra / 3.0 M parameters • Public release (after 1.5 yrs) • DR1 (2015.03) : 1.8M spectra/1.0M parameters • DR2 (2016.06): 3.0M spectra / 2.1 M parameters • Collaboration on LAMOST Sciences