Download
1 / 48
480 likes | 655 Views
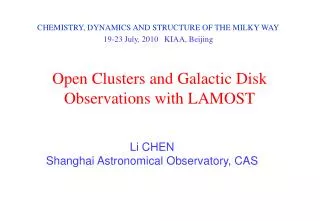
Test observations with LAMOST. Yongheng Zhao National Astronomical Observatories of China. Characteristics of LAMOST. Effective aperture 3.6-4.9 meter FOV 5 ( 1.75m linear ) Number of fibers 4000

E N D
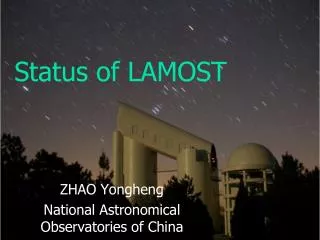
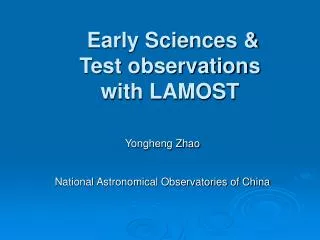
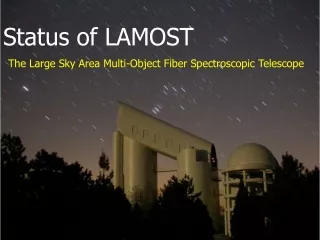
Test observations with LAMOST Yongheng Zhao National Astronomical Observatories of China
Characteristics of LAMOST • Effective aperture 3.6-4.9 meter • FOV 5(1.75m linear) • Number of fibers 4000 • Observing sky area -10 +90 • Spectral resolution R=1000/2000 (+5000/10000) • Survey capability spectral resolution 1nm, integration time 1.5 hours, magnitude limit: 20.5m • Size of fiber 3.30 arcsec( 320 macro linear) • Site seeing: ~2 arcsec
Enclosure Oct 20, 2007
(July 13,2008) • Segmented Active optics for 37 sub-mirrors of MB
(Sept. 10, 2008) • Segmented and thin mirror active optics for 24 sub-mirrors of MA
Image quality of LAMOST <1” Target: < 2” (Nov. 21, 2008)
At 5.2 degrees FOV Oct. 11, 2008
At 3.2 degree FOV • FWHM<10pixel, ~2 arcsec Apr.25, 2009 Image quality: 0.3-0.4 arcsec Seeing: 1.7-2 arcsec
Pointing< 5” Target: < 10”
Tracking 0.632“(80%) 0.52"(rms) Target: < 1”
Instruments • 4000 Fibers (130km) • 4000 Fiber positioning units • 16 Spectrographs • 250 fibers per spectrograph • 32 4k x 4k CCD Cameras • E2V CCD chips
Focal Plate for holding 4000 fibers Positioning unit with 2 step motors Double arm scheme
Repeat accuracy of 4000 units <0.14” target: <0.5”
16 spectrographs 250 fibers per spectrograph RL = 1000/2000 RM= 5000/10000 Spectral range: Low blue: 370—590nm red: 570—900nm Medium blue: 510nm — 540nm red: 830nm — 890nm
Relative efficiency of fiber to fiber (No.6 spectrograph-blue)
Efficiency of spectrograph 370~900nm • 43% (peak) • Target :35%(peak)
Test Observations • Sept. 2008 – June 2009 • Test observations for check • Oct. 2009 – Jan. 2010 • Test observations for scientific WGs • Several dark nights in each month
Spectra of bright stars(28/9/2008) Blue Red
Apr.1, 2009 Galaxies (g>19)
Apr.1, 2009 QSOs (g>19)
Apr. 26, 2009 • Stars (V<19) • More than 3600 spectra got in one test observation (>90% of selected objects)
No.5: red No.4: red
Early Sciences Test observations for scientific WGs • Observations: 97 exposures (each 1.5h) • Oct. 2009: 20 for stars • Nov. 2009: 20 for stars, 6 for galaxies • Dec. 2009: 18 for stars, 10 for galaxies • Jan. 2010: 18 • Feb. 2010: 7 • Data quality is not good
Oct. 26 M31 area
M31 • 17 new PNs two exp. in Oct. & Dec.
Beyond M31: 14 new QSOs
8 New QSOs 1 exp. In Dec.
Candidates of metal-poor stars • 19 with S/N>15 • 9 with [Fe/H]<-1
8 MP stars [Fe/H]~-2.7
Main tasks Now • Positioning accuracy of 4000 fibers • 2-3” (target: 0.5”) • Efficiency of FP Instruments • 16 spectrographs • 32 CCD cameras • 2D pipeline • Sky subtraction
Positioning errors • “fiber scan”
July 6 • σx=1.7”, σy=2.3” ΔY (“) ΔX (“)
Positioning of 4000 fibers • Transformation of Coords. • 4000 coordinates for 4000 fibers • Fiber coords. Focal plane coords • 4000(x0,y0,θ0) • FP coords. CCD coords.(celetial) • Shift, rotation, expanding • Symmetric errors • measurement correction
CCD0 CCD3 CCD2 CCD1 Coord. of 4000 fibers Coord. of 4 guiding CCDs
Celestial coords measured by 4 guiding CCDs CCD coords Fiber coords
July 6 • σx=1.7”, σy=2.3” • σx=1.1”,σy=1.2”
Plan • July-Sep. • Positioning accuracy for 4000 fibers • Fine adjusting of spectrographs & CCDs • 2D pipeline • Oct.-Dec. • Scientific test observations • Jan.-June • Test for scientific surveys
视宁度(导星CCD测量) • 日期:20091122 • 天区:06faint • 中央星:124.7456700 56.2547100 7.00 3.70 -8.40 • Seeing:11*0.24= 2.64角秒(CCD:4033)(时间:04:30) • 日期:20091221 • 天区:sky5f • 中央星:91.0300674 23.2636089 5.09 0.00 0.00 • Seeing:8*0.24= 1.92角秒(CCD:6033)(时间:1:12)
光纤对准测定 单高斯 拟合: x0,y0 FWHM F*, Fb
焦平面调整(3月) • 光轴+焦平面 • 共面 • S-H中心(焦点) • 4000光纤端面 • 4导星CCD靶面