Download
1 / 44
440 likes | 559 Views
Albemarle County 2004 Citizen Survey. October 6, 2004. Authors. Thomas M. Guterbock Director Anna MacIntosh Research Analyst Katherine Draughon Research Consultant. Survey Goals. Determine residents’ opinions about quality of life in Albemarle County

E N D
Albemarle County 2004 Citizen Survey October 6, 2004
Authors Thomas M. Guterbock Director Anna MacIntosh Research Analyst Katherine Draughon Research Consultant
Survey Goals • Determine residents’ opinions about quality of life in Albemarle County • Assess residents’ satisfaction with County’s efforts to achieve its Strategic Planning goals • Determine residents’ level of satisfaction with County services • Measure opinion about the way in which the County is managing growth • Measure change on key indicators
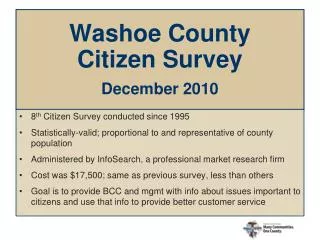
Survey Features • N of 707 • Margin of error +/- 3.7% • Some questions comparable to 1994 and 2002 surveys • Field Period: June 2004
More Features • RDD (random digit dialing) • Respondent selection within household • Balanced cross-section of County population, with post-weighting of sample • CATI (computer-assisted telephone interviewing) • Solid interviewer training
On a 10-point Scale… • The mean rating is 7.96 • Seventy-one percent gave the county an “8” or better • Sixteen percent gave the county a “10” • Twelve percent rated the county “6” or lower
Quality of Life • Not significantly different from 1994 or 2002
High Ratings Come From… • Women • Those residents who have lived in Albemarle longer and older residents • Homemakers, students, or retired residents • Those residents with high incomes • Homeowners and those who live in single family homes • Those who reported themselves as living “out in the country” and those living in the rural areas in the southern & western parts of the County
Questions drawn from County’s four strategic directions: • providing high quality educational opportunities for Albemarle County citizens of all ages; • protecting the County’s natural, scenic, and historic resources; • enhancing the quality of life for all Albemarle County citizens; and • providing effective and efficient County services to the public in a courteous and equitable manner.
Most satisfied with… • Efforts to make the County a safe and healthy community (94%) • Efforts to create learning opportunities for all ages (93%) • Efforts to provide effective, responsive, and courteous service to customers (90.8%)
Least Satisfied with… • Efforts to promote the development of affordable places to live (48.1%) • Efforts to protect and preserve the County’s rural character (67.6%) • Efforts to provide needed infrastructure (68.6%) . . . See page 18 of report for full list.
Satisfaction With Value for Tax Dollar Percent satisfied: 80.4%
Overall Satisfaction with County Services Percent Satisfied: 90.6%
Overall Satisfaction • Not significantly different from 2002 • Significantly greater than 1994
Of the 27 Satisfaction Items in the Survey… • 22 had satisfaction levels of 60% or better • 16 items had satisfaction levels of 75% or better
Satisfaction was highest for… • Fire protection 95.9% • Library services 95.0% • Emergency rescue services 94.3% • Safety in business areas 92.6% • Police protection 92.4%
Satisfaction was lowest for… • Ease of getting around by public transportation 45.8% • Level of recycling services 54.2% • Safety for walkers and bicyclists 55.3% • Efforts to manage growth 56.4% • Supporting adequate housing 56.5%
Satisfaction with Quality of Education • 85% in 2004 • Not significantly different from 2002 • 92.2% of those with children in schools were satisfied
In General… • Residents were most satisfied with public safety items. • Items related to growth management had lower satisfaction ratings.
Changes from 2002 • No significant increases • Significant decreases in 9 items
What Went Down… • Efforts to manage growth • Ease of getting around by car • Ease of getting around by public transportation • Efforts to protect natural resources and the environment • Efforts to preserve open space • Safety for walkers and bicyclists
And Also Down… • Keeping citizens informed about programs and services • Emergency rescue services • Efforts to support adequate housing
Contact with County • During the past 12 months, 45.7% of respondents contacted the County government • Most frequently contacted departments were: • Finance • Police • Building Code/Zoning Services
Satisfaction with Contact • 81.5% were satisfied with the helpfulness of County employees • 84.9% agreed that the length of time that they had to wait for service was within reason • 83.5% were satisfied overall with their experience contacting the County.
Support for Development Areas Percent Favoring: 69.9%
How Can we Attract People to Live in Urban Areas? We asked: “Please tell me how important each service is for attracting people to live in the urban areas rather than the rural areas within the County.” • Very important • Somewhat important • Not very important
How Can we Attract People to Live in Urban Areas? Most important: • Public utilities • Faster emergency response times • A variety of housing types
How Can we Attract People to Live in Urban Areas? Least important: • Having a mix of commercial, residential, and/or office uses • Having bikeways • Having neighborhood or corner stores Substantial variation by subgroup
Shopping Outside of County Almost half (46.5%) had traveled outside of Albemarle County for the primary purpose of shopping in the past month. Most Frequently Visited Destinations: • Richmond Area • Staunton/Waynesboro • Northern Virginia Most Frequently Purchased Items: • Clothing • Groceries • Housewares
The Survey Said… • Residents are very satisfied with the quality of life in Albemarle County • Ratings of most County services remain high • There are some significant decreases from the 2002 survey, especially in growth-related service areas • Residents are concerned about issues related to growth and development
Overall Satisfaction with County Services Percent Satisfied: 90.6%
Albemarle County2004 Citizen Survey October 6, 2004
For further information please contact: Thomas M. Guterbock Director 434-243-5223 TomG@virginia.edu www.virginia.edu/surveys