Chapter 3 Descriptive Statistics: Numerical Methods
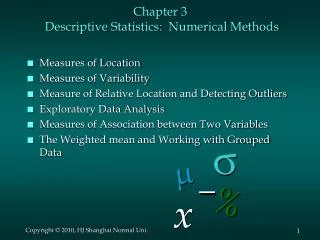
Chapter 3 Descriptive Statistics: Numerical Methods. Measures of Location Measures of Variability Measure of Relative Location and Detecting Outliers Exploratory Data Analysis Measures of Association between Two Variables The Weighted mean and Working with Grouped Data. . . %. x.

Chapter 3 Descriptive Statistics: Numerical Methods
E N D
Presentation Transcript
Chapter 3 Descriptive Statistics: Numerical Methods • Measures of Location • Measures of Variability • Measure of Relative Location and Detecting Outliers • Exploratory Data Analysis • Measures of Association between Two Variables • The Weighted mean and Working with Grouped Data % x
3.1 Measures of Location • Mean (均值) • Median (中位数) • Mode (众数) • Percentiles (百分位数) • Quartiles (四分位数)
Example: Apartment Rents Given below is a sample of monthly rent values ($) for one-bedroom apartments. The data is a sample of 70 apartments in a particular city. The data are presented in ascending order.
Mean • The mean(平均值) of a data set is the average of all the data values. • If the data are from a sample, the mean is denoted by . • If the data are from a population, the mean is denoted by m (mu).
Example: Apartment Rents • Mean
Median • The median(中位数)is the measure of location most often reported for annual income and property value data. • A few extremely large incomes or property values can inflate the mean.
Median • The median of a data set is the value in the middle when the data items are arranged in ascending order. • For an odd number of observations, the median is the middle value. • For an even number of observations, the median is the average of the two middle values.
Example: Apartment Rents • Median Median = 50th percentile i = (p/100)n = (50/100)70 = 35 Averaging the 35th and 36th data values: Median = (475 + 475)/2 = 475
Mode • The mode(众数)of a data set is the value that occurs with greatest frequency. • The greatest frequency can occur at two or more different values. • If the data have exactly two modes, the data are bimodal. (双峰) • If the data have more than two modes, the data are multimodal. (多峰)
Example: Apartment Rents • Mode 450 occurred most frequently (7 times) Mode = 450
Percentiles • A percentile(百分位数)provides information about how the data are spread over the interval from the smallest value to the largest value. • Admission test scores for colleges and universities are frequently reported in terms of percentiles.
Percentiles • The pth percentile of a data set is a value such that at least p percent of the items take on this value or less and at least (100 - p) percent of the items take on this value or more. • Arrange the data in ascending order. • Compute index i, the position of the pth percentile. i = (p/100)n • If i is not an integer, round up. The pth percentile is the value in the ith position. • If i is an integer, the pth percentile is the average of the values in positions i and i+1.
Example: Apartment Rents • 90th Percentile i = (p/100)n = (90/100)70 = 63 Averaging the 63rd and 64th data values: 90th Percentile = (580 + 590)/2 = 585
Quartiles • Quartiles (四分位数) are specific percentiles • First Quartile = 25th Percentile • Second Quartile = 50th Percentile = Median • Third Quartile = 75th Percentile
Example: Apartment Rents • Third Quartile Third quartile = 75th percentile i = (p/100)n = (75/100)70 = 52.5 = 53 Third quartile = 525
Measures of Variability • It is often desirable to consider measures of variability (dispersion), as well as measures of location. • For example, in choosing supplier A or supplier B we might consider not only the average delivery time for each, but also the variability in delivery time for each.
Measures of Variability • Range (极差) • Interquartile Range (四分位点内距) • Variance (方差) • Standard Deviation (标准差) • Coefficient of Variation (变异系数)
Range • Therange(极差)of a data set is the difference between the largest and smallest data values. • It is the simplest measure of variability. • It is very sensitive to the smallest and largest data values.
Example: Apartment Rents • Range Range = largest value - smallest value Range = 615 - 425 = 190
Interquartile Range • The interquartile range(四分位点内距)of a data set is the difference between the third quartile and the first quartile. • It is the range for the middle 50% of the data. • It overcomes the sensitivity to extreme data values.
Example: Apartment Rents • Interquartile Range 3rd Quartile (Q3) = 525 1st Quartile (Q1) = 445 Interquartile Range = Q3 - Q1 = 525 - 445 = 80
Variance • Thevariance(方差)is a measure of variability that utilizes all the data. • It is based on the difference between the value of each observation (xi) and the mean (x for a sample, m for a population).
Variance • The variance is the average of the squared differences between each data value and the mean. • If the data set is a sample, the variance is denoted by s2. • If the data set is a population, the variance is denoted by 2. (sigma)
Standard Deviation • The standard deviation(标准差)of a data set is the positive square root of the variance. • It is measured in the same units as the data, making it more easily comparable, than the variance, to the mean. • If the data set is a sample, the standard deviation is denoted s. • If the data set is a population, the standard deviation is denoted (sigma).
Coefficient of Variation • The coefficient of variation(变异系数)indicates how large the standard deviation is in relation to the mean. • If the data set is a sample, the coefficient of variation is computed as follows: • If the data set is a population, the coefficient of variation is computed as follows:
Example: Apartment Rents • Variance • Standard Deviation • Coefficient of Variation
% x Chapter 3 Descriptive Statistics: Numerical Methods • Measures of Relative Location and Detecting Outliers • Exploratory Data Analysis • Measures of Association Between Two Variables • The Weighted Mean and Working with Grouped Data
Measures of Relative Locationand Detecting Outliers • z-Scores (Z-分数) • Chebyshev’s Theorem (切比雪夫定理) • Empirical Rule (经验法则) • Detecting Outliers (异常值检测)
z-Scores (Z-分数) • The z-score is often called the standardized value. • It denotes the number of standard deviations a data value xi is from the mean. • A data value less than the sample mean will have a z-score less than zero. • A data value greater than the sample mean will have a z-score greater than zero. • A data value equal to the sample mean will have a z-score of zero.
Example: Apartment Rents • z-Score of Smallest Value (425) Standardized Values for Apartment Rents
Example:Z-scores for the class-size • Sample mean: 44; sample standard deviation:8
Chebyshev’s Theorem (切比雪夫定理) At least (1 - 1/z2) of the items in any data set will be within z standard deviations of the mean, where z is any value greater than 1. • At least 75% of the items must be within z = 2 standard deviations of the mean. • At least 89% of the items must be within z = 3 standard deviations of the mean. • At least 94% of the items must be within z = 4 standard deviations of the mean. 与均值的距离必定在z个标准差以内的数据比例至少为(1 - 1/z2)
Example: the midterm test scores • the midterm test scores for 100 students in a college business statistics course had a mean of 70 and a standard deviation of 5. How many students had test scores between 60 and 80? How many students had test scores between 58 and 82? • 60-80: • Z60 =(60-70)/5=-2 ; Z80=(80-70)/5=2; • At least (1 - 1/(2)2) = 0.75 or 75% of the students have scores between 60 and 80. • 58-82?
Example: Apartment Rents • Chebyshev’s Theorem (切比雪夫定理) Let z = 1.5 with = 490.80 and s = 54.74 At least (1 - 1/(1.5)2) = 1 - 0.44 = 0.56 or 56% of the rent values must be between - z(s) = 490.80 - 1.5(54.74) = 409 and + z(s) = 490.80 + 1.5(54.74) = 573
Example: Apartment Rents • Chebyshev’s Theorem (continued) Actually, 86% of the rent values are between 409 and 573.
Empirical Rule(经验法则) For data having a bell-shaped distribution: • Approximately 68% of the data values will be within onestandard deviation of the mean.
Empirical Rule For data having a bell-shaped distribution: • Approximately 95% of the data values will be within twostandard deviations of the mean.
Empirical Rule For data having a bell-shaped distribution: • Almost all (99.7%) of the items will be within threestandard deviations of the mean.
Example: Apartment Rents • Empirical Rule Interval% in Interval Within +/- 1s 436.06 to 545.54 48/70 = 69% Within +/- 2s 381.32 to 600.28 68/70 = 97% Within +/- 3s 326.58 to 655.02 70/70 = 100%
应用:six sigma(六西格玛) • 用“σ”度量质量特性总体上对目标值的偏离程度。几个西格玛是一种表示品质的统计尺度。任何一个工作程序或工艺过程都可用几个西格玛表示。 • 六个西格玛可解释为每一百万个机会中有3.4个出错的机会,即合格率是99.99966%。而三个西格玛的合格率只有93.32%。 • 六个西格玛的管理方法重点是将所有的工作作为一种流程,采用量化的方法 分析流程中影响质量的因素,找出最关键的因素加以改进从而达到更高的客户满意度。
Detecting Outliers (异常值检测) • An outlier is an unusually small or unusually large value in a data set. • A data value with a z-score less than -3 or greater than +3 might be considered an outlier. • It might be: • an incorrectly recorded data value • a data value that was incorrectly included in the data set • a correctly recorded data value that belongs in the data set
Example: Apartment Rents • Detecting Outliers The most extreme z-scores are -1.20 and 2.27. Using |z| > 3 as the criterion for an outlier, there are no outliers in this data set. Standardized Values for Apartment Rents
Exploratory Data Analysis (探索性数据分析) • Five-Number Summary (五数据概括法) • Box Plot (箱形图)
Five-Number Summary • Smallest Value (最小值) • First Quartile (第一四分位数) • Median (中位数) • Third Quartile (第三四分位数) • Largest Value (最大值)
Example: Apartment Rents • Five-Number Summary Lowest Value = 425 First Quartile = 450 Median = 475 Third Quartile = 525 Largest Value = 615
Box Plot • A box is drawn with its ends located at the first and third quartiles. • A vertical line is drawn in the box at the location of the median. • Limits are located (not drawn) using the interquartile range (IQR). • The lower limit is located 1.5(IQR) below Q1. • The upper limit is located 1.5(IQR) above Q3. • Data outside these limits are considered outliers.
Box Plot (Continued) • Whiskers (dashed lines) are drawn from the ends of the box to the smallest and largest data values inside the limits. • The locations of each outlier is shown with the symbol* .
Example: Apartment Rents • Box Plot Lower Limit: Q1 - 1.5(IQR) = 450 - 1.5(75) = 337.5 Upper Limit: Q3 + 1.5(IQR) = 525 + 1.5(75) = 637.5 There are no outliers. 575 600 625 450 375 400 500 525 550 425 475