Download
1 / 40
410 likes | 449 Views
Learn to produce resource charts, cash flow estimates, and optimize resource availability through activity floats. Discover strategies to manage overdraft requirements and break-even points. Explore resource graphs, coordination strategies, and resource smoothing techniques in project scheduling. Understand the factors affecting capital lock-up and optimize project costs for profitability.

E N D
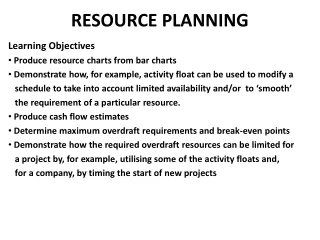
RESOURCE PLANNING Learning Objectives Produce resource charts from bar charts Demonstrate how, for example, activity float can be used to modify a schedule to take into account limited availability and/or to ‘smooth’ the requirement of a particular resource. Produce cash flow estimates Determine maximum overdraft requirements and break-even points Demonstrate how the required overdraft resources can be limited for a project by, for example, utilising some of the activity floats and, for a company, by timing the start of new projects
Resource graph (Labourers) Activity 1 2 3 4 5 6 7 8 9 10 11 Week Concreting 4 4 4 4 4 4 4 labourers per week Brickwork 2 2 2 2 2 2 labourers per week Excavation 1 1 1 1 1 1 1 labourer per week Sum: 4 4 4 6 7 7 3 3 1 1 1 2 3 4 5 6 7
Resource graph (Cranes) Activity 1 2 3 4 5 6 7 8 9 Month A 1 1 1 1 0 B 0 1 1 1 1 1 1 0 C 0 0 1 1 1 Sum: 1 1 2 3 2 2 1 1 Crane 1 Crane 2 Crane 3
‘Ideal’ resource graph Time A gradual increase followed by a gradual reduction Quantity
Strategy 1Do not change the schedule but buy additional resources at extra cost Activity Time A B (A) (A) (B) Maximum level of resource available Resource
Strategy 2Activity A proceeds as scheduled and Activity B is moved in time Activity Time A B (A) (A) (B) Maximum level of resource available Resource
Strategy 3Part of Activity A and all of Activity B proceeds as scheduled and the rest of Activity A is delayed Activity Time A B (A) (B) (A) Maximum level of resource available Resource
Strategy 4Both Activity A and Activity B are re-scheduled with longer durations Activity Time A B (A) (A+B) (A+B) Maximum level of resource available Resource
Resource ‘smoothing’ 0 2 2 6 6 7 A D H 2w/3L 4w/0L 1w/4L 5 7 7 11 11 12 0 0 2 2 7 7 11 11 14 15 START B E J L END 2W/6L 5w/0L 4w/2L 3w/4L 0 0 2 3 8 8 12 12 15 15 2 10 F 8w/4L 2 10 Four ‘paths’ 0 1 1 4 10 15 B – F – K (=Critical) C G K C – G – (K) 1w/4L 3w/5L 5w/2L (B) – E – J - L 6 7 7 10 10 15 A – D – H – (L)
Activity 1 2 3 4 5 6 7 8 9 10 11 12 13 14 15 Weeks B 6 6 Critical F 4 4444444 Critical K 2 2222 Critical A 3 3 TF = 5 D 0 000 TF = 5 H 4 TF = 5 C 4 TF = 6 G 5 55 TF = 6 E 0 0000 TF = 1 J 2 222 TF = 1 L 0 00 TF = 1 SUM: 13 14 9 9 4 4 8 6 66 4 2 222All start at ES 5 10 Max req. is 14 15
Activity 1 2 3 4 5 6 7 8 9 10 11 12 13 14 15 Weeks B 6 6 Critical F 4 4444444 Critical K 2 2222 Critical A 3 3 TF = 5 used up D 0 000 TF = 5 used up H 4 TF = 5 used up C 4 TF = 6 used up G 5 55 TF = 6 used up E 0 0000 TF = 1 used up J 2 222 TF = 1 used up L 0 00 TF = 1 used up SUM: 6 6 4 44 7 11 9 11 11 4 8 2 2 2All start at LS 5 10 Max req. is 11
Activity 1 2 3 4 5 6 7 8 9 10 11 12 13 14 15 Weeks B 6 6 Critical F 4 4444444 Critical K 2 2222 Critical A 3 3 Delay A by 2 wks D 0 000 Delay D by 2 wks H 4 Delay H by 2 weks C 4 Delay C by 4 wks G 5 55 Delay G by 4 wks E 0 0000 ES J 2 222 ES L 0 00 ES SUM: 6 6 7 7 8 9 911 106 4 2 2 2 2Delay A by 2 wks Delay C by 4 wks 5 10 Max req. is 11
DATA NEEDED TO MAKE A FORCAST The project costs broken down into labour, materials, plant, fees, subcontractors and other headings. The delay between incurring a cost liability under these headings and actually having to meet that liability. The amounts of money you need to pay out at different points in time can then be determined and is often described as a graph of costs versus time. A graph of the value (which is the contractors cost plus a margin) versus time, representing the money a contractor will eventually receive. The measurement and certification intervals, i.e. how often can the contractor invoice the client? Normally specified in the contract. The payment delay between certification/invoicing and receiving the money, also specified in the contract. From this we get a graph of income versus time. The retention conditions and retention repayment conditions.
Terminology COST: Money that you have to pay out MARGIN: What you add on to your direct cost for profit and overheads when you tender for a job. VALUE: The value to the client of the work you have completed. Equals the cost plus the margin. INCOME: Money you receive from the client
CAPITAL LOCK-UP Accumulated Income $ Accumulated Cost Time +$ Accumulated Nett Cash Time -$
CAPTIM = Capital x time +$ (Accumulated Nett) 2000 1000 Month -1000 -2000 -3000 -4000 -5000 -$ Sum of overdrafts = 1000 + 2000 + 3000 + 5000 + 4000 + 2000 + 1000 = 18000 $month Say, Annual interest rate = 15% Approx. interest cost = 18 000 * 0.15/12 = $225
FACTORS THAT AFFECT THE CAPITAL LOCK-UP • Margin Acc Income (Big margin) Acc Income (Small margin) Acc Cost NOTE: The area between the red and the black lines is bigger than the area between the blue and the black lines, i.e. less capital lock-up with a bigger margin
FACTORS THAT AFFECT THE CAPITAL LOCK-UP 1. Margin 2. Retention
FACTORS THAT AFFECT THE CAPITAL LOCK-UP Margin Retention Claims
FACTORS THAT AFFECT THE CAPITAL LOCK-UP Margin Retention Claims Front-end loading
Example 1 2 3 4 5 6 7 8 9 mth A $25 000 $25 000 B $50 000 $50 000 C $30 000 $30 000 D $20 000 $20 000 Using 20% margin on all activity costs and a cost-plus payment plan M. Cost 25 000 25 000 50 000 50 000 30 000 30 000 20 000 20 000 M. Income 30 000 30 000 60 000 60 000 36 000 36 000 24 000 24 000 A. Cost 25 000 50 000 100 000 150 000 180 000 210 000 230 000 250 000 250 000 A. Income 30 000 60 000 120 000 180 000 216 000 252 000 276 000 300 000 • Nett -25 000 -20 000 -40 000 -30 000 0 6 000 22 000 26 000 50 000 Max overdraft is $40 000 and break even at end of month 5
Using 20% margin on all activity costs (as before) M. Cost 25 000 25 000 50 000 50 000 30 000 30 000 20 000 20 000 M. Income 30 000 30 000 60 000 60 000 36 000 36 000 24 000 24 000 A. Cost 25 000 50 000 100 000 150 000 180 000 210 000 230 000 250 000 250 000 A. Income 30 000 60 000 120 000 180 000 216 000 252 000 276 000 300 000 • Nett -25 000 -20 000 -40 000 -30 000 0 6 000 22 000 26 000 50 000 Using 40% margin on A, 20% on B, 16.67% on C and 0% on activity D M. Cost 25 000 25 000 50 000 50 000 30 000 30 000 20 000 20 000 M. Income 35 000 35 000 60 000 60 000 35 000 35 000 20 000 20 000 A. Cost 25 000 50 000 100 000 150 000 180 000 210 000 230 000 250 000 250 000 A. Income 35 000 70 000 130 000 190 000 226 000 260 000 280 000 300 000 A. Nett -25 000 -15 000 -30 000 -20 000 10 15 000 30 000 30 000 50 000 Max overdraft reduced to $30 000 and break even earlier
FACTORS THAT AFFECT THE CAPITAL LOCK-UP Margin Retention Claims Front-end loading Over-measurement
FACTORS THAT AFFECT THE CAPITAL LOCK-UP Margin Retention Claims Front-end loading Over-measurement Back-end loading and Under-measurement
FACTORS THAT AFFECT THE CAPITAL LOCK-UP Margin Retention Claims Front-end loading Over-measurement Back-end loading and Under-measurement Delay in receiving money from the client
FACTORS THAT AFFECT THE CAPITAL LOCK-UP Margin Retention Claims Front-end loading Over-measurement Back-end loading and Under-measurement Delay in receiving money from the client Delay in paying suppliers, workers, plant-hire companies etc
FACTORS THAT AFFECT THE CAPITAL LOCK-UP Margin Retention Claims Front-end loading Over-measurement Back-end loading and Under-measurement Delay in receiving money from the client Delay in paying suppliers, workers, plant-hire companies etc Company cash flow
SUMMARY Cash flow forecasting provides warnings for potential cash flow problems. Steps to take to reduce this risk are: Not to take on new projects unless the cash flow is manageable Re-negotiate overdraft facilities with your bank based on updated forecasts Negotiate extended credits with suppliers, even if that means losing some of your discounts.
Tutorial: Cash flow This is the same project as in the CPM Tutorial example. You will therefore already have the Earliest start (ES) and Earliest Finish (EF) times calculated for each activity but you can also draw the bar chart from the information here. Activity Duration Depends on activity Cost A 3 weeks - $6 000 B 2 - 4 000 C 5 A 5 000 D 6 A and B 6 000 E 4 Half of D 8 000 F 4 C 12 000 G 5 D 10 000 H 8 C and E 16 000 I 9 D 9 000 J 6 I and H 12 000 K 18 B 18 000 L 4 K 8 000 Carry out a cash flow analysis for the above project in order to determine the maximum overdraft required, the time when the project breaks even and the final margin. You can assume that the contractor invoices the client, for his/her costs, plus a margin of 10%, after every two weeks and that the client pays the full amounts in the following two-week period. Also plot the Accumulated Net Cash graph.
DISCOUNTED CASH FLOW Compound amount factor = (1 + i)n $100 today left for two years in account earning 10%/year will grow to $100 * (1 + 0.1)2 = $121 Discount factor = 1/(1 + i)n $121 two years from now is, in today’s money value, worth $121 * 1/(1 + 0.1)2 = $100 This is referred to as the PRESENT VALUE
Example of comparing investments Say that you can invest $100 000 in the following different ways. Which is best? Leave the money in a savings account earning 12% annually Invest in a project giving a return of $120 000 in six month time Invest in a project giving a return of $140 000 in two years time Invest in a project giving $80 000 in six month and another $50 000 in two years time. Invest in a project giving $ 110 000 in one years time.
Use the annual rate of 12% to calculate the present value of the other alternatives. The present value of alternative A is then $100 000. B. $120 000 * 1/(1+0.12)0.5 = $120 000 * 0.9449 = $113 389 C. $140 000 * 1/(1+0.12)2 = $140 000 * 0.70719 = $111 607 D. $80 000 * 1/(1+0.12)0.5 + $50 000 * 1/(1+0.12)2 = $115 453 E. $110 000 * 1/(1+0.12)1 = $98 214 Conclusion: ‘D’ is the best alternative as it has the highest present value. Note that alternative ‘E‘ is worse than keeping the money in the bank.
Process to find the NPV Step 1. Determine (guess) the future interest rate Step 2. Calculate the discount factors that apply to each of the future payments Step 3. Discount each of the future transactions to today’s money value Step 4. Add together those discounted cash flows to find the Nett Present Value (NPV) of the project’s cash flow.
To determine the discount rate for shorter periods, like month. Say that the annual discount rate is 10%. On a monthly basis we get (1 + i)n = (1 + 0.1)1/12 so, (1 + i) = 1.00797414, which we use for the discounting. If your payments are done on a 4-weekly basis, use n = 13. For a weekly basis use 52 etc.
The NPVs varied between ~$33 000 and ~$61 000 depending on the payment plan, when in each case it looked as if the profit was $50 000. Quite a difference, don’t you think? This further emphasizes the importance of paying out moneys as late as possible and receiving moneys as early as possible.