Download

1 / 29
330 likes | 693 Views
Online Shopping Habits. Josh, Anthony, Jennifer and Samantha. Agenda. Secondary data Survey Hypotheses / Results Findings Conclusion Interpretation. Secondary Data. Online shoppers are: Spending more time online Buying more often Spending more money in the process

E N D
Online Shopping Habits Josh, Anthony, Jennifer and Samantha
Agenda • Secondary data • Survey • Hypotheses / Results • Findings • Conclusion • Interpretation
Secondary Data • Online shoppers are: • Spending more time online • Buying more often • Spending more money in the process • Average of $86.31 in 2000 compared to $49.53 in 1998 • Total purchases increased from $4 billion in 1998 to $23 billion in 2000. • Source: Wharton Study 2000
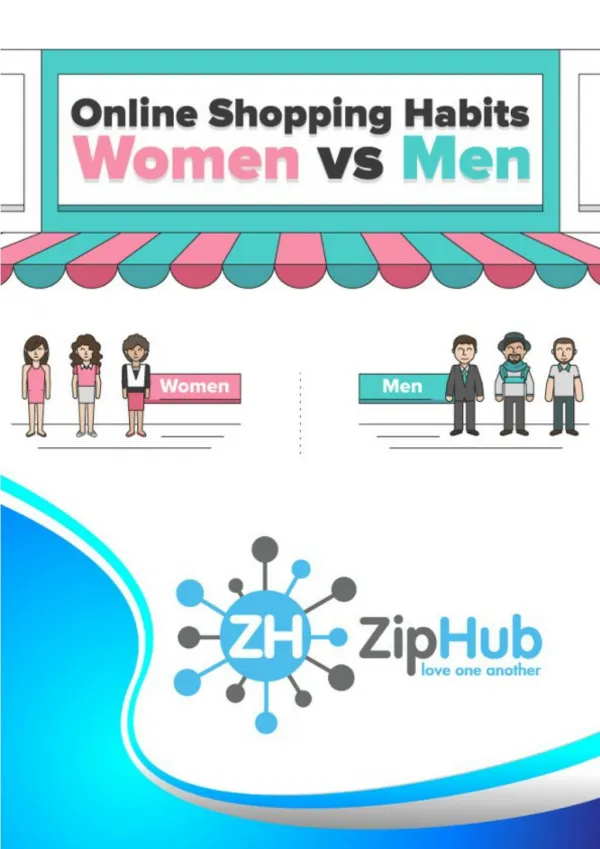
Secondary Data • Men shop online more than women • 53% of online shoppers are men • 47% are women • This is because • Men are early adopters of the internet • Feel more comfortable providing credit card information • Source: Wharton Study 2000
Secondary Data • Growth of at-home broadband access has grown from 15-27 million users over the course of a year. And of other users who have home Internet access, 8% plan to acquire broadband access in the present year. • Source: Arbitron Study
Secondary Data • 92% of Americans are concerned about credit card theft online • Source: pewinter study
Nearly All Consumers Have Concerns About Online Shopping • Source: Hart Research for WAVE Systems
Survey • 34 questions asked • 100 respondents • Convenience sample • Conducted the week of May 6, 2002
Sample Questions • Nominal Scale- a measurement that assigns only an identification or label to an object or set of objects. Example: • Have you ever purchased a product from a company on the internet? • Yes • No
Sample Questions • Ordinal Scale- a measurement that assigns only a rank or order to a set of objects. Example: • Rank the type of site from which you most often make purchases? • Travel • Flowers/Gifts • Books/Music/ Movies • Electronics/Computers • Clothes • Financial Services
Sample Questions • Interval Scale- a scale with the property that units have the same width throughout the scale. Example: • How secure do you feel internet shopping is? 1---2---3---4---5---6---7---8---9---10 Not Secure Very Secure
Sample Questions • Ratio Scale- a measurement that has a true or meaningful zero point, allowing for specification of absolute magnitudes of objects. Example: • What is the maximum amount you are willing to spend on an online purchase?
Hypotheses • 4 Hypotheses tested
Overview of T-test • T-test assesses whether the mean of two groups are statistically different from each other.
Hypothesis #1 • H0- Frequency of online shopping is equal for men and women • mm= mw • H1- Frequency of online shopping is not equal for men and women • mm≠ mw • Q3 Have you ever purchased a product/service online? • Q12 how many times do you shop online? • Q30 What is your gender?
Results • We calculated the appropriate statistic: • tobt = -0.470 • Now we need to evaluate it based on its sampling distribution: • |tobt| > |tcrit| • df = N – 2 = 75-2 = 73 • Look in Table A-4 • For 95% confidence interval, tcrit =1.993 • Since 0.470 < 1.993, we accept H0
Hypothesis #2 • H0- Frequency of online shopping is equal for dial-up and broadband customers • md= mb • H1- Frequency of online shopping is not equal for dial-up and broadband customers • md≠ mb • Q4 How do you connect to the internet? • Q12 how many times do you shop online?
Results • We calculated the appropriate statistic: • tobt = -1.018 • Now we need to evaluate it based on its sampling distribution: • |tobt| > |tcrit| • df = N – 2 = 77-2 = 75 • Look in Table A-4 • For 95% confidence interval, tcrit =1.992 • Since 1.018 < 1.993, we accept H0
Hypothesis #3 • H0- Fraud on the internet influences online purchases • mf=mnf • H1- Fraud on the internet does not influence online purchases • mf≠ mnf • Q15 How much does potential credit card fraud influence online purchases?
Results • We calculated the appropriate statistic: • tobt = 15.444 • Now we need to evaluate it based on its sampling distribution: • |tobt| > |tcrit| • df = N – 1 = 75-1 = 74 • Look in Table A-4 • For 95% confidence interval, tcrit =1.993 • Since 15.444 > 1.993, we reject H0
Hypothesis #4 • H0- Online purchases are made in equal amounts in each of the identified categories • mf= mnf • H1- Online purchases are not made in equal amounts in each of the identified categories • mf≠ mnf • Q20 From what category was your first online purchase • Q21 Rank the type of site from which you most often make purchases
Results • Respondents indicated a preference for the category of “Books/music/movies” when ranking sites most used for purchases • Additionally 30% made their first purchase at one of the sites in this category • So, we reject H0
Conclusion • Secondary data supports all the hypotheses • Primary data supports 2 of the 4 hypotheses • Credit card fraud results differed from secondary data • Expected one category to be preferred over the others and survey revealed most popular category
Interesting Results • 11% have no access to the Internet • 46% have been on the internet more than 4 years • 70% use the internet daily • 42% consider their skill level on the Internet to be expert
Interesting Results • 60% use offline information to shop online at least occasionally • 63% use online information to shop offline at least occasionally • 41% rate price the most important factor when shopping online
Interpretation • Data supports continued growth of online shopping creating business opportunities • Faster internet connections and software advancements will create new ways to shop online