Valuation 9: Contingent Choice
240 likes | 510 Views
Valuation 9: Contingent Choice. Contingent Choice Modelling and its variants Some econometrics Application to green product choice. Previously, we looked at. Revealed and stated preference methods

Valuation 9: Contingent Choice
E N D
Presentation Transcript
Valuation 9:Contingent Choice • Contingent Choice Modelling and its variants • Some econometrics • Application to green product choice
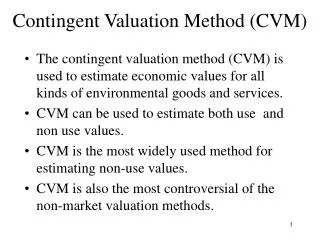
Previously, we looked at • Revealed and stated preference methods • Revealed preferences methods (hedonic pricing, travel costs) have the advantage of being based in actual behaviour, but can only capture use value • Stated preference methods (contingent valuation) do not have this restriction, but are entirely hypothetical
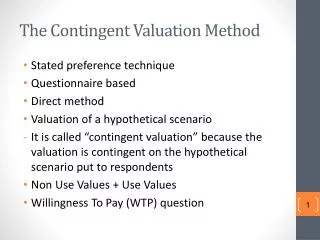
Contingent Choice • (Contingent) choice modelling is similar to contingent valuation in that it is a stated preference technique based on surveys • The main difference is that instead to asking „who much are you willing to pay“, the question is „which situation would you prefer“ • Choice modelling comprises choice experiments, contingent ranking, contingent rating and paired comparisons • Similar to conjoint analysis, apart from the interpretation of the results
Choice Experiments • Which of the following two schemes do you favour? • Native woodland 500 ha 700 ha • Heather moorland 1200 ha 0 ha • Lowland hay meadow 200 ha 300 ha • Additional tax $25 $15 • I would prefer A B Neither
Contingent Ranking • Rank the alternative policy options • Woodland 500 ha 100 ha 700 ha • Moorland 1200 ha 600 ha 0 ha • Meadow 200 ha 0 ha 300 ha • Tax $25 $5 $15 • Your ranking 1 2 3 • Note that this does not correspond to typical market behaviour!
Contingent Rating • How strongly would you prefer the following? • Native woodland 500 ha • Heather moorland 1200 ha • Lowland hay meadow 200 ha • Additional tax $25 • 1 2 3 4 5 6 7 8 9 10 • Very low preference Very high preference • Again, not common market behaviour
Paired Comparisons • Which of these do you prefer? • Woodland 500 ha 700 ha • Moorland 1200 ha 0 ha • Meadow 200 ha 300 ha • Tax $25 $15 • 1 2 3 4 5 6 7 8 9 10 • Strongly prefer A Strongly prefer B
Choice Modelling • Provided that „do nothing“ is included, choice experiments and contingent ranking can be used to estimate WTP or WTAC • If „do nothing“ is not included, the set of options may be infeasible for the interviewee, resulting in nonsensical results • Contingent rating does not yield WTP, as there is only one alternative • Pairwise comparison is like a CVM referendum, but with shades of grey that are difficult to interpret
CM v CV • Choice modelling allows for more nuanced distinctions – but this also implies that more situations need to be assessed, that the questionnaire gets longer, and the interviewee may tire • In choice modelling, money is less central (less protest votes), and preferences more • In choice modelling, the econometrics is considerably more complicated
Implementation • Characterise the decision problem • Select attributes and levels • Develop questionnaire • Design experiment • Collect data • Estimate model • Apply model
Econometrics • Ordinary least squares assumes that variables are continuous • In choice modelling, the observations are discrete, often 0-1 • How to interpret such data? • Techniques are known as random utility, discrete choice, logit ... • Random utility is the most common name in economics (and psychology) • It start by saying that one would choose option 0 if its utility is higher than option 1
Econometrics -2 • One would choose option 0 if its utility is higher than option 1: U0 > U1 • Utility consist of a structural and an ideosyncratic component Ui = Xi+vi • The vector X describes the attributes that influence utility • The vector has the attribute weights • The scalar v is the random component of utility • P(U0 > U1) = P(X0- X1>v0 –v1)
Econometrics -3 • P(U0 > U1) = P(X0- X1>v0 –v1) • Under appropriate assumptions, this becomes p = X0 / X0 +X1 • The model predicts the probability that option 0 is chosen • Choose such that ∑(y-p)2 (for example) is minimal • Above, we do logit and least squares, but we could also use other assumption on the distribution of v and other distance metrics
Econometrics -4 • Above, we use 0-1 decisions, and use attributes of the choice only • Adding attributes of the decision maker is trivial • There may be more than two choices • If ordered, relatively straightforward: • 0.0<p<0.5 -> 0; 0.5<p<1.0 -> 1 • 0.0<p<0.3 -> 0; 0.3<p<0.7 -> 1; 0.7<p<1.0 -> 2 • If not, complicated: P(U0> U1) and P(U0> U2) have to be evaluated separately; this gets messy when there are many choices
Green product choice • Product: Toilet paper; advantages: widely used; many varieties, some green, some not; close to reality • Canberra, 1 supermarket, year unknown • Three focus groups as a preparation; to find out important attributes, and to test questionnaire • 1100 questionnaires, 2 week period, 40% response rate • Questionnaire made clear that this was not for profit
Attributes • Price and special on price • Number of rolls in pack (2, 4, 6, 8) • Number of ply (1, 2, 3) • Number of sheets • Softness, as claimed • Colour • Scent • Type of paper (standard, recycled, unbleached) • Brand; this is not really an attribute, but a bundle of attributes; has to be included because of habit
Choices • With 8 attributes, the number of combinations is quite astounding • 128 types were created, using something like Latin Hypercube sampling • Each interviewee was asked to choose between 8 types, so that the sample was split in 16 subsamples • Recall that only 440 surveys were returned • Sampling strategy was stratified for time of day only, based on expert guesses
Results • The model predicts the probability of buying a product, given its characteristics, and the characteristics of the buyer (green, like scent, cheap, decor, clean, age) • Positive: Special, no. rolls, no. plys, white, coloured, unbleached and recycled • Negative: Price, off-white, standard, unbleached, scented • Interactive effect between stated and actual greenness • Green brands have negative dummies
Prices • The model contains both price and environmental attributes • That implies that one can compute the increase in price that would correspond to a greener product • The average respondent is willing to pay $0.66 extra to pay for recycled and unbleached toilet paper (this is for the average pack, attributes and price unspecified) • For greens, its $1.69, $0.39 for others
Yea-saying • Yea-saying is one of the biases in stated preference methods; it means that the interviewee gives the answer that she thinks the interviewer wants to hear • Harmony is preferred over conflict, and if harmony can be had by a little lie ... • Consumer shopping survey (Green products) • By completing this survey, you will assist our understanding of what people do when they go shopping (and how they go about choosing among products that claim to have different implications for the environment)
Prices -2 • First: The average respondent is willing to pay $0.66 (0.33) extra to pay for recycled and unbleached toilet paper; For greens, its $1.69, $0.39 for others • Second: The average respondent is willing to pay $0.61 extra to pay for recycled and unbleached toilet paper; for greens, its $1.57, $0.33 for others • These differences are not-significant, but that may be because of the data • The preference for green paper increased, as did the number of self-proclaimed greens; but so did price-sensitivity and the preference for standard paper
Revealed preferences • Another nice thing about toilet paper is that it is actually sold in all the varieties tested in the survey • How do the results compare to actual sales data? • Only aggregate sales are available, so one has to redo the stated preference model for the average consumer • A formal test of differences between the models is tricky, because the buyers face different choices than do the interviewees, but the differences seem to be significant
RP v SP1 v SP2 • Price –0.36 (0.53) v –0.40 (0.02) v –0.48 (0.02) • Special 0.46 (0.02) v 0.18 (0.02) v 0.13 (0.02) • Roll 0.15 (0.03) v 0.23 (0.01) v 0.29 (0.01) • White 0.24 (0.06) v 0.11 (0.04) v 0.04 (0.04) • Standard –0.17 (0.14) v –0.07 (0.05) v –0.06 (0.05) • Unbleach 1.09 (0.15) v –0.12 (0.09) v –0.25 (0.09) • UB & rec –0.13 (0.12) v 0.23 ( 0.04) v 0.27 (0.04) • Stated preferences deviate from revealed ones, even for standard products like toilet paper, and even for such innocent things as its colour