Source: see below
New York City in 2000. Zip Code Areas Grouped in quintiles by income and SAR: (Darkest areas have lowest income/ highest SAR). Income poverty in New York City Zipcodes 2000. (a) Poverty: Median Income. poorest. richest. Standardized Admisssion Ratios Males 15-64: NYC 2000.

Source: see below
E N D
Presentation Transcript
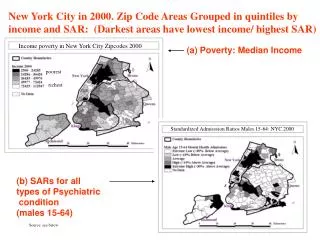
New York City in 2000. Zip Code Areas Grouped in quintiles by income and SAR: (Darkest areas have lowest income/ highest SAR) Income poverty in New York City Zipcodes 2000 (a) Poverty: Median Income poorest richest Standardized Admisssion Ratios Males 15-64: NYC 2000 (b) SARs for all types of Psychiatric condition (males 15-64) Source: see below
This map is taken from the following paper: M. Almog, S. Curtis, A. Copeland, and P. Congdon, Geographical variation in acute psychiatric admissions within New York City 1990-2000: growing inequalities in service use? Social Science and Medicine, 2004;59, 2,361-376 .