Download

1 / 18
180 likes | 199 Views
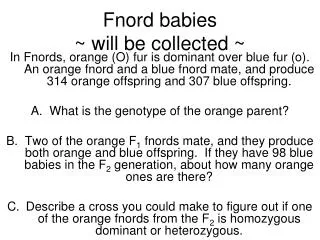
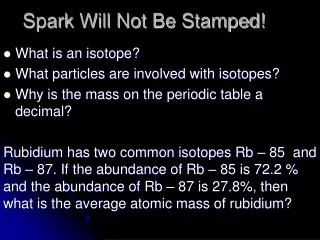
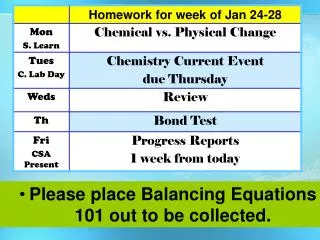
x ft. Please have out your HOMEWORK to be stamped. SECRET CODE MAD will be collected. Complete through Pythagorean Theorem on your SKILL BUILDER NOW!. = 265. 20+30+30+45+45+45+50. 7. Mean = 38. MAD 9.6. 18+8+8+7+7+7+12. = 67. 7. = 68. 4+8+8+10+10+12+16. 7. Mean = 9.7. = 18.3.

E N D
x ft Please have out your HOMEWORK to be stamped. SECRET CODE MAD will be collected. Complete through Pythagorean Theorem on your SKILL BUILDER NOW!
= 265 20+30+30+45+45+45+50 7 Mean = 38 MAD 9.6 18+8+8+7+7+7+12 = 67 7 = 68 4+8+8+10+10+12+16 7 Mean = 9.7 = 18.3 5.7+1.7+1.7+0.3+0.3+2.3+6.3 7
What is a scatterplot? A scatterplot is a type of graph that uses plotted points to show patterns in bivariate data. Title y-axis points x-axis Labels Source: http://pdphoto.org/PictureDetail.php?mat=pdef&pg=5274 Source: http://en.wikipedia.org/wiki/File:Oldfaithful3.png
What is a correlation? A correlation is an association between quantities. Features of correlation: • Linearity – linear or nonlinear • Strength – strong or weak • Slope – positive or negative
Features of a correlation: Linear Forms a straight line Linearity Nonlinear Does NOT form a straight line Strong Points are close together Strength Weak Points are far apart positive As x increases, y increases Slope negative As x increases, y decreases No pattern means nocorrelation.
Constructing a Scatterplot: Example #1 Linearity: Linear Strength: Strong Slope: Negative Summary: Students with more missing assignments tend to have lower report card grades
Constructing a Scatterplot: Example #2 Side Length and Volume of a Cube Linearity: Nonlinear Strength: Strong Slope: Positive Summary: The volume of a cube increases rapidly as its side length increases
Constructing a Scatterplot: Example #3 Linearity: Linear Strength: Weak Slope: Positive Summary: In general, people who work more hours earn more money
Constructing a Scatterplot: Example #4 No Correlation Summary: There does not appear to be a correlation between the number of pets a student owns and the student’s height.
HOMEWORK: STATSTICS #5 MEAN ABSOLUTE DEVIATION