Download
1 / 24
240 likes | 261 Views
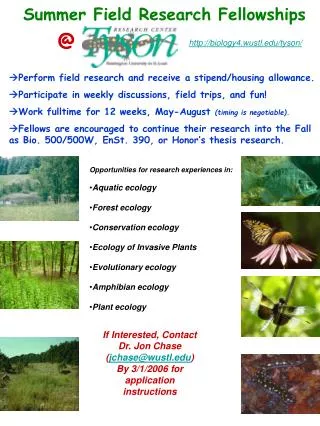
Join a summer training workshop at Harvard Forest to learn how to set up forest plots with students, identify tree species, measure tree diameter, and calculate carbon biomass. Discover the excitement of field ecology and the importance of studying our changing forests.

E N D
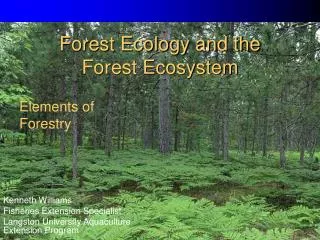
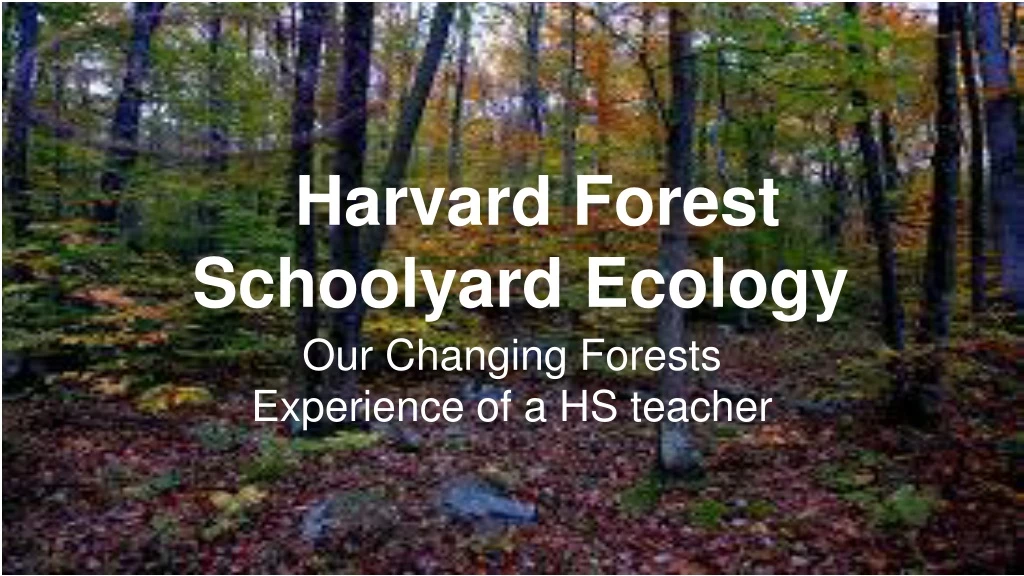
Harvard Forest Schoolyard Ecology Our Changing Forests Experience of a HS teacher
August 2013: Summer training workshop at Harvard Forest First Step
Setting up the plot If students do it with you….. Compass practise is a must. Practise on an athletic field first! Set up plot, use hypotenuse to check (14.2 ft.) and adjust. Place stakes. This is a suggested way to keep a class of 24 busy, however you could also divide the class in half and have 2 teams of 12 compete to make the most perfect plot. In the woods- 6 students per corner (2 in charge of compass, 2 drag out the tape, and 1 place the stake. Three students in charge of checking hypotenuse and adjusting corners). Takes a full block to practise and a full block to set up the plot with students. My blocks are 82 minutes long. If you don’t have time set up the plots without the students.
Next the ecologist and I( or students and I ) identified some of the major species in the plot- red maple, scrub oak, hemlock and white pine
Tagging the trees Teach students about DBH in classroom. Have students measure something. I have used beakers, trash cans, students heads.. Then go out, approximate how many trees on the plot, hand out the number of tags per group and nails or wire, remind students about the 2.5 cm rule. If time students can try to ID trees also.(this can be chaotic and students may miss some trees or skip some in the numbering scheme. I fixed my trees after students had skipped a couple)
All the trees greater than 2.5 cm diameter were tagged with a metal marker.
I set up my first plot with an ecologist from Harvard Forest. The second one I did with students. Both are within a ten minute walk from the school. It is easier to set up the plots and tag the trees without students but not as fun!
After plot has been set up and Before going out to plotHarvard forest presentation by Josh Rapp Students practice identifying trees by branches in the classroom Students practice measuring DBH and learn what it is in the classroom Students set up a mock 10 m x 10 m plot (most fun) outside on an athletic field
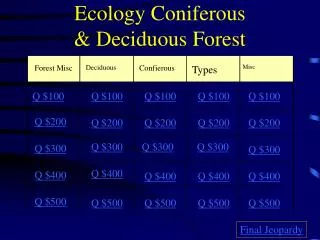
Identify the trees and fill out the field description Practice identification in the classroom. Cut some twigs from the plot and have student groups ID them. Some basics: trees are evergreen or deciduous leaves are opposite or alternate, or simple or compound An acronym for oppositely branched trees MADCapHorse Maple, ash, dogwood, caprifoliaceae (mostiy viburnum) and horse chestnut
This is a screen-shot of part of the document I hand out to students to help them ID trees.
Dr. Albertine came out for the second time to help introduce three classes of from 18 to 25 students, to the site. The ecologists are very helpful!
Students worked in groups of 3. They each had clipboards, id books, and shared the dbh tape and dbh stick.
Identifying Trees Includes native and commonly introduced trees of the U.S. and Canada east of the Rockies and north of Florida. By May Theilgaard Watts. Website for the "Finder Series" of Dichotomous Keys I recommend this inexpensive pocket dichotomous key. Students find these keys easy to use.
Students can use graphing tools on the Harvard website to compare basal area, stand density and carbon biomass after data has been submitted.
Alternatively students can use dbh to calculate carbon biomass Tree biomass equations Units: biomass = kilograms, dbh = centimeters Biomass (metric tons) = biomass (kilograms)/1000 Carbon biomass = 0.5 * biomass Default = red maple if biomass equation not available Acer pensylvanicum (ST) biomass = (exp(7.227+1.6478*log(dbh/2.54)))/1000 Acer rubrum (RM) biomass = 0.1262*(dbh^2.3804) Acer saccharum (SM) biomass = 0.1008*(dbh^2.5735) Betula alleghaniensis (YB) biomass = 0.1684*(dbh^2.4150) Betula lenta (BB) biomass = 0.0629*(dbh^2.6606) Betula papyrifera (WB) biomass = 0.0612*(dbh^1.6287) Betula populifolia (GB) biomass = 0.1564*(dbh^2.3146) Betula spp. (RB) biomass = 0.0629*(dbh^2.6606) Castanea dentate (CH) biomass = 2.204*(exp(0.95595+2.4264*log(dbh/2.54))) Fagus grandifolia (BE) biomass = 0.1967*(dbh^2.3916)
Students learn: How to look closely at an outdoor site How to measure DBH and identify common tree species What field ecology is like and how to measure change in a forest About stand density and basal area and how they relate to carbon biomass How fun it is to go outside!