Download
1 / 9
90 likes | 181 Views
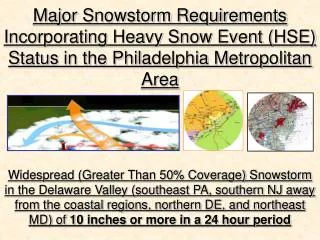
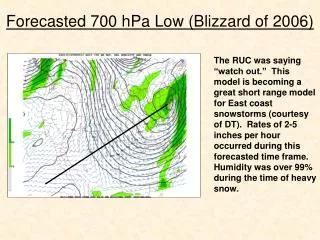
Forecasted 700 hPa Low (Blizzard of 2006). The RUC was saying “watch out.” This model is becoming a great short range model for East coast snowstorms (courtesy of DT). Rates of 2-5 inches per hour occurred during this forecasted time frame. Humidity was over 99% during the time of heavy snow.

E N D
Forecasted 700 hPa Low (Blizzard of 2006) The RUC was saying “watch out.” This model is becoming a great short range model for East coast snowstorms (courtesy of DT). Rates of 2-5 inches per hour occurred during this forecasted time frame. Humidity was over 99% during the time of heavy snow.
Table V HINTS FOR FORECASTING MODERATE TO HEAVY SNOW (S+) 700 mb • S+ band between -6C and -8 C (-7 C best) temperature, and south of -10 C dew point line. • S+ band along path and just left of low • Snow begins at 700 mb ridge line and ends at trough line • S+ band with greatest moisture at H7 • North of the 700 mb closed contour
Other Factors: 700 mb Analysis Many of the same processes analyzed on the 850 chart are also studied on the 700 mb chart. The trough/ridge pattern becomes more defined at the 700 mb levels as compared to lower levels. A trough is simply a southern "bulge" in height contours while a ridge is a northerly displaced "bulge". This "bulge" can be large (such as in association with a mid-latitude cyclone) or small (such as a shortwave).
Other Factors: 700 mb Analysis When examining model data at 700 millibars it is common for them to show upward vertical velocity. A good forecast strategy is to look at the 700 mb forecast panels for the upward vertical velocity distribution, then determine what forces in the atmosphere are causing the upward (or downward) vertical velocities.
Other Factors: 700 mb Analysis (1) Find areas with low dewpoint depressions. Often this indicates a deep layer of moisture. Use 700 mb chart in combination with sfc and 850 charts to determine depth of moisture(2) Determine strength of warm air advection, cold air advection, and moisture advection. Thermal advection is a function of wind speed, wind direction, thermal gradient, and isotherm angle of intersection with height contours(3) Determine strength of high pressure/ low pressure. Strong organizing low pressures tilt toward the northwest with height.
Other Factors: 700 mb Analysis (4) Locate shortwaves. Determine if shortwave is barotropic or baroclinic. Baroclinic shortwave is more likely to produce precipitation. Rain and storms are generally on exit sector of shortwave. Compare shortwave with other levels in the atmosphere. Rain is likely to right of shortwave especially if dewpoint depressions are low.(5) Weather is warmer than normal under ridges and cooler than normal under troughs.
Other Factors: 700 mb Analysis Click on this site for 700mb initialization and forecasts. http://weather.unisys.com/eta/init/eta_700_init.html (6) Look for the greatest height falls and height rises; these values give clues to how the trough/ridge pattern will change through time.(7) 700 mb front is found where height contours kink; kinking height contours may also be a shortwave (especially if thermal advection is present). A short wave can be an upper level front.
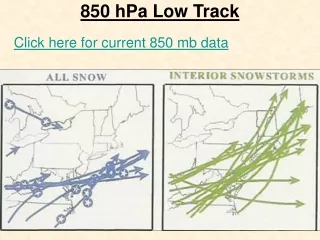
Other Factors: 700 mb Analysis According to Henry Margusity of Accu-Weather, “the position of the 700 mb low is critical for snow in Philly. The 700 mb represents the mid layer conveyer belt that brings in moisture to the west of the storm over cold air. It the 700mb low tracks just over, then Philly will be in good position for snow.”
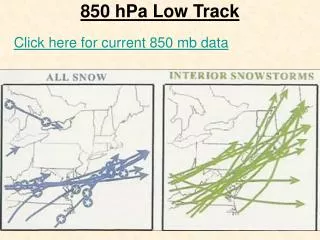
Surface Low, 500 mb Low,850 Low, and 700 Low Merge February 11-12, 2007