Download
1 / 67
720 likes | 927 Views
Applications to Biosphere. Artists impression of Spot 5.

E N D
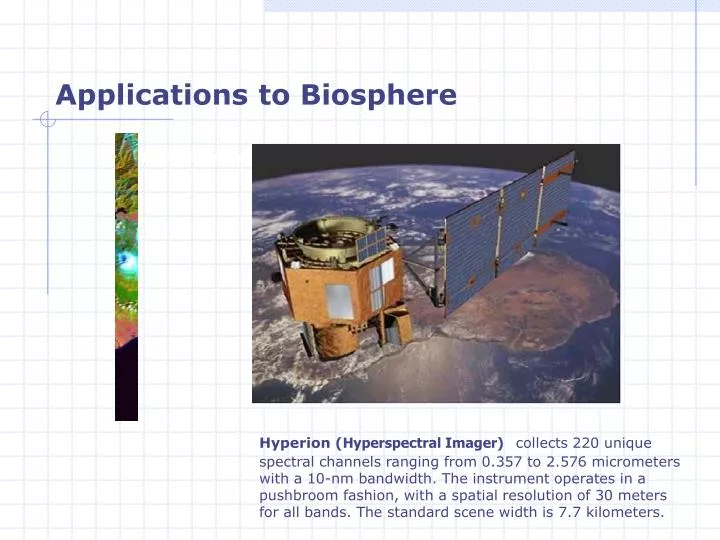
Applications to Biosphere Artists impression of Spot 5 Hyperion (Hyperspectral Imager) collects 220 unique spectral channels ranging from 0.357 to 2.576 micrometers with a 10-nm bandwidth. The instrument operates in a pushbroom fashion, with a spatial resolution of 30 meters for all bands. The standard scene width is 7.7 kilometers.
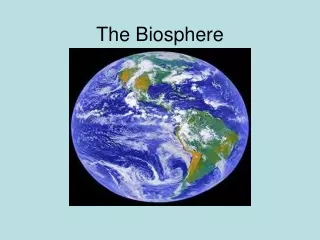
Applications to Biosphere The part of the earth and its atmosphere in which living organisms exist or that is capable of supporting life. The ecosystem composed of the earth and the living organisms inhabiting it. The objectives: Remote sensing of the vegetation
Remote Sensing of Vegetation: Outline Artists impression of Spot 5 Physical basis Spectral reflectance characteristics Assessment of plant stress Vegetation classification Estimation of biomass Angular reflectance characteristics Vegetation indices Phenological cycles Multi-sensor, multi-resolution considerations
Remote Sensing of Vegetation: Outline Artists impression of Spot 5 Natural color image (RGB = red, green, blue) Color-infrared image (RGB = near-infrared, red, and green) When we look in the near-infrared region using color-infrared photography, which is just beyond what we can see with our eyes, actively growing plants are highly reflective because of the multiple scattering that takes place between the spongy-mesophyll cells of the plant
Plant Communities Artists impression of Spot 5 • Global change and regional analyses are aided by knowledge of vegetation behavior and distribution • Species and community distribution (land cover maps) • Phenological (growth) cycles and stress • Temporal and physiological variations
Photosynthesis Fundamentals Artists impression of Spot 5 About 70% of the Earth’s land surface is covered with vegetation Oil and coal provide more than 90% of the energy needed to power human activities, which is originally “captured” from the Sun by plants growing millions years ago and transformed into fossil fuels This is achieved through photosynthesis, an energy-storing process that takes place in leaves and other green parts of plants in the presence of light. Therefore, photosynthesis, indirectly the principal means of enabling a civilized society to function normally and it is the sole means of sustaining life
Photosynthesis Fundamentals Artists impression of Spot 5 Photosynthesis: The process by which plants use light energy trapped by chlorophyll to convert water and carbon dioxide into stored energy or food • The photosynthetic process is described by the equation: • 6CO2 + 6H20 + light energy = C6H12O6 + 6O2 • Light energy is stored in a simple sugar molecule (glucose) that is produced from CO2 present in the air and H20 absorbed by the plant primarily through the root system • When the CO2 and the H20 are combined to form a sugar molecule in a chloroplast, O2 is released as a by-product • The photosynthetic process begins when sunlight strikes chloroplasts, small bodies in the leaf that contain a green substance called chlorophyll
Physical basis for Remote Sensing of Vegetation Artists impression of Spot 5 Photosynthesis Pigmentation Leaf structure Plant water content Canopy structure Phenological cycles
Photosynthesis and Spectral Characteristics Artists impression of Spot 5 Energy-storage in plants, powered by light absorption by leaves Leaf structures have adapted to perform photosynthesis, hence their interaction with electromagnetic energy has a direct impact on their spectral characteristics
Visible, Near IR and Middle IR Interactions • Spectral reflectance characteristics of healthy vegetation for the region 0.4-2.6 (μm). • Factors controlling leaf reflectance: leaf pigments (e.g. chlorophyll a and b) in the palisade mesophyll, the scattering of NIR in the spongy mesophyll, and the amount of water in the plant. • Chlorophyll absorption bands: 0.43-0.45 μm, and 0.65-0.66 μm • Water absorption bands: 0.97, 1.19, 1.45, 1.94, and 2.7 μm
Leaf Cell Structure CO2 enters stomata Chloroplasts present in both palisade parenchyma and spongy parenchyma mesophyll cells
Visible and Near IR Interactions Spectral character of light reflected by normal plant is controlled by two groups of cells: Long Narrow Cells below epidermis called palisade cells; these contain mainly chloroplasts with chlorophyll pigments, absorb blue and red, and reflect green light Spongy mesophyll layer (oxygen and carbon exchange), NIR unaffected by chloroplasts, but strongly reflected by mesophyll Generalized diagram of a leaf’s structure and its reflectance characteristics at visible and NIR wavelengths
Near IR Interactions within the Spongy Mesophyll High leaf reflectance in the NIR results from scattering/reflectance from the spongy mesophyll This layer is composed of cells and air spaces (lots of scattering interfaces)
Visible light interactions with pigments Chlorophyll a and b are the most important plant pigments absorbing blue and red light Have other pigments present in the palisade mesophyll cells These are usually masked by the abundance of chlorophyll pigments During senescence in the fall or encounters of stress the carotenes and other pigments often become dominant Artists impression of Spot 5
Multiple Scattering in the Plant Canopy: Leaf additive reflectance • The main reasons that healthy plant canopies reflect so much near-infrared energy are: • the leaf already reflects 40-60 % of the incident NIR energy from the spongy mesophyll • the remaining 45-50 % of the energy penetrates through the leaf and can be reflected once again by leaves below it • This is called leaf additive reflectance • The greater the number of leaf layers in a healthy, mature canopy, theoretically the greater the infrared reflectance
Multiple Scattering in the Plant Canopy: Leaf additive reflectance
Assessment of plant senescence and/or stress • A healthy green leaf has very low reflectance values in the red (600-700 nm) due to chlorophyll absorption and very high reflectance values in the near-infrared (700-1000 nm) • As the plant begins to senesce, reflectance begins to decrease in the near-infrared and increase in the red
Spectral information about plant senescence and/or stress The decline in reflectance in the near-infrared is due to the spongy-mesophyll layer collapsing as the leaf comes under stress The increase in reflectance in the red is caused by the die-off of chlorophyll and therefore a decrease in absorption We can therefore use this information to evaluate vegetation type, condition, or density
Spectral information about plant senescence and/or stressMiddle IR Interactions with Water in the Spongy Mesophyll Plant water content absorbs middle IR radiation Middle IR plant reflectance increases as leaf moisture content decreases Middle IR reflectance can be used to monitor plant water stress
Thermal Emission and Plant Water Stress Measures of thermal emission can be used to derive surface temperature for a crop As water transpires from a plant, it’s leaves are cooled If a plant is stressed, it’s leaf temperature increases A thermal image of a cotton canopy that was part of a water and nitrogen study in Arizona. Blues and greens represent lower temperatures than yellow and orange. The image was acquired with a thermal scanner on board a helicopter.
Plant Water and Transpiration • Reflectance response of Magnolia leaf to decreased relative water content • As water content decreased, reflectance increased throughout 0.4-2.5 μm • The greatest increase occurred in the middle infrared region (1.3-2.5 μm)
Spectral Characterization of Vegetation Types AVIRIS data collected over the San Luis Valley of Colorado, with 224 spectral channels of 20 x 20 m data were radiometrically corrected to remove the effects of atmospheric water vapor and geometrically rectified to a standard map projection
Plumes of algae in Lake Victoria Aquatic Plants aquatic plants absorb solar energy and emit thermal radiation (warmer than surrounding water) This can be detected in thermal imagery
Vegetation classification with SAR • SAR X- C- L- and P-band • Used for measurements of biomass and moisture of canopies
Seasonal variation of the measured attenuation at 10.2 GHz for a soybean canopy
Relationship between height of pine populations and radar image tone
0 0-5 5-10 10-15 15-20 20-25 25-30 >30 Vegetation Height Measurements • ICESat’s accurate ranging capability enables large-scale biomass estimates from canopy height • 50-70 meter footprint limits assessment to large scales • More detail requires smaller footprints Courtesy of M. Lefsky, Col. State U. M. Lefsky, Colorado State University
Estimation of biomass using GLAS Source: Pflugmacher, 2007
Estimation of biomass using GLAS Source: Pflugmacher, 2007
Estimation of biomass using GLAS Source: Pflugmacher, 2007
Estimation of biomass using GLAS Source: Pflugmacher, 2007
Classification of five crop types using like-, and cross polarized backscattering measurements in C-band
Angular Reflectance Properties of Vegetation • Vegetation reflects light unevenly, in different directions (“anisotropic reflectance”) • Depends on: • leaf shape • canopy structure • vegetation density • Described by “Bidirectional Reflectance Distribution Function” (BRDF)
Bidirectional Reflectance Dependence of observed energy on relationship among the surface, the observer, and the source of illumination Bidirectional Reflectance Distribution Function (BRDF): Describes fraction of energy observed as a function of illumination and viewing angles • Sometimes spectral signatures depend on illumination and viewing angles • Often necessary to relate observed energy to incident energy (e.g. for albedo calculation)
What are BRDF effects? Most surfaces on earth expose a relationship between the amount of reflected radiance and the directions of the sun’s irradiance and sensor viewing geometry (bidirectional) According to a specific viewing and irradiance geometry an object appears brighter or fainter Bidirectional reflectance effect on a mowed lawn as a result of the mow pattern causing different orientation of the grass leaves.
+75° (backscatter) +45° (backscatter) 0° (nadir) -45° (forwardscatter) -75° (forwadscatter) Bidirectional reflectance effect on a grass lawn The BRDF effect is most pronounced in the so-called solar principal plane where the source of illumination, target and sensor are in one plane: Bidirectional reflectance effect on a grass lawn, observed under different viewing angles from a FIGOS mounted camera in the solar principal plane. Solar zenith angle is 35°, indicated with red arrows.
Hot spot direction The bidirectional effect in remote sensing data is most obvious in the hot spot direction where illumination and viewing orientation are identical. The oblique air photograph below shows the hot spot effect over a bare soil area.
Angular Reflectance Properties of Vegetation The concept and parameters of the BRDF. A target is bathed in irradiance from a specific zenith and azimuth angle and the sensor records the radiance exiting the target of interest at a specific azimuth and zenith angle (see pg. 369) Goniometers are used to measure targets from multiple azimuth and zenith angles
Angular Reflectance Properties of Rye Grass for Four Spectral Bands Ryegrass anisotropy factors for 4 wavelengths at a range of zenith angles. It is this type of information that the Terra MISR instrument is designed to obtain.
Estimating vegetation structure from multiangular measurements The bidirectional reflectance distribution function (BRDF) of bare soils or of homogeneous vegetated surfaces is usually bowl-shaped. However, when the heterogeneity of the canopy is intermediary, it is possible that the reflectance of the whole surface becomes larger for an observer at the zenith than when this same surface is observed at some larger zenith angle. In this case, the BRDF exhibits a bell-shaped pattern. These findings lead to new ways to characterize the properties of land surfaces, and in particular their heterogeneity. Source: Bertrand et al. (2002)
Vegetation Indices A vegetation index is a simple mathematical formula Used to estimate the likelihood that vegetation was actively growing at the time of data acquisition Widely used over several decades More than 20vegetation indices in use New, more sensitive vegetation indices have been developed
Vegetation Indices Make use of the red vs. NIR reflectance differences for green vegetation
Normalized Difference Vegetation Index (NDVI) Reduces atmospheric illumination differences ρred = Reflectance in red channel ρNIR = Reflectance in NIR channel
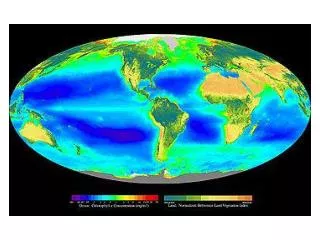
Normalized Difference Vegetation Index (NDVI) AVHRR images of the Amu-Dar'ja Delta just south of the Aral Sea in Uzbekistan (south-central Asia). The amount of vegetation present in the delta (a major farming district for this region) is expressed as the NDVI