Download
1 / 53
530 likes | 634 Views
Development of a verification methods testbed at the WRF DTC. Mike Baldwin Purdue University. Acknowledgements. WRF Developmental Testbed Center visiting scientist program Beth Ebert Barbara Casati Ian Jolliffe Barb Brown Eric Gilleland. Motivation for new verification methods.

E N D
Development of a verification methods testbed at the WRF DTC Mike Baldwin Purdue University
Acknowledgements • WRF Developmental Testbed Center • visiting scientist program • Beth Ebert • Barbara Casati • Ian Jolliffe • Barb Brown • Eric Gilleland
Motivation for new verification methods • Great need within both the research and operational NWP communities for new verification methods • High-resolution forecasts containing realistic detail/structure • Ensembles/probabilistic forecasts
OBSERVED FCST #1: smooth Forecast #1: smooth OBSERVED FCST #2: detailed
Traditional performance measures • Often fail to provide meaningful information when applied to realistic forecasts • Many of the unfavorable aspects of traditional measures are well-known • Yet such measures continue to be used extensively
Why? • History • Continuity • Familiarity • Understandable • Comfort level • A certain degree of credibility has been established after forecast performance has been measured over several decades
New methods • Plenty of new verification methods have been proposed • Features-based • Morphing • Scale decomposition • Fuzzy/neighborhood • Why haven’t they caught on?
Why haven’t they caught on? • Usability has not been demonstrated • No history • Difficult to interpret results • Credibility has not yet been established
good performance poor performance Fuzzy verification framework from Beth Ebert (2008)
Weaknesses and limitations • Less intuitive than object-based methods • Imperfect scores for perfect forecasts for methods that match neighborhood forecasts to single observations • Information overload if all methods invoked at once • Let appropriate decision model(s) guide the choice of method(s) • Even for a single method … • there are lots of numbers to look at • evaluation of scales and intensities with best performance depends on metric used (CSI, ETS, HK, etc.). Be sure the metric addresses the question of interest! from Beth Ebert (2008)
Typical path to acceptance and adoption of new verif methods • Develop a new technique • Test it on a small number of cases • Publish those results and methodology • Apply the technique to forecasts on a routine basis • Build up a collection of results • Compare the new and traditional methods • ACCEPT: when users become satisfied with the behavior of the new method
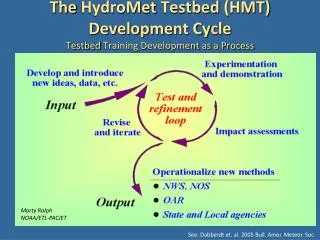
Propose a testbed for verification methods • Provide access to a database of operational and experimental forecasts • Covering a period of several years • Compare new and traditional measures • Collaborate with users of verification information • This will help to speed up the process of establishing credibility and eventual use
Long-period database of forecasts • NCEP Operational: • GFS • NAM • model grid spacing • QPF (3h and 24h accumulations) • truth: Stage IV analyses • CONUS region • 00 and 1200 UTC initial times • archive period: 1999-present • additional fields (temperature, heights) may be added
Forecast archive • Experimental: • WRF runs produced to support SPC/NSSL HWT in 2004, 2005, 2007, 2008 • 2004 and 2005 data already in hand • used as part of Spatial Forecast Verification Intercomparison Project (ICP) • hourly QPF: Stage IV analyses • additional fields (surface temps, reflectivity) to be added if feasible
Formats • Forecasts will be available in several standard data formats (GRIB to start with) • Archived will be maintained by DTC • Software routines will be provided to read data, interpolation library • Work with MET verification package • traditional scores • some new methods currently available
Testbed • Fits into the WRF/DTC framework • Provides a “proving ground” for new methods • Answer operational concerns • How much time does a method take to run? • How much time/effort is required to analyze results? • How should information be presented to users? • Compare with traditional methods? • How do results change before/after major model upgrades?
Collaboration with users • Subjective component • SPC/NSSL HWT (Spring Program) has collected extensive subjective/expert ratings of experimental WRF model forecasts • DTC facilitates transfer from research to operations • Potential use for training
“Show me” • The testbed will allow researchers to demonstrate meaningful ways to apply new verification information • Applied to current operational models • accelerate the process of improving guidance • Event-based errors for specific classes of phenomena • Error scales
Possible additions • OPeNDAP/THREDDS access • regions beyond the U.S. • possible WGNE QPF verification data • ensemble forecasts • grid-to-obs capability
General verification framework • Any verification method should be built upon the general framework for verification outlined by Murphy and Winkler (1987) • New methods can be considered an extension or generalization of the original framework • Joint distribution of forecasts and observations: p(f,o)
general joint distribution • p(f,o) : where f and o are vectors containing all variables, matched in space and time • o could come from data assimilation • joint distribution difficult to analyze • different factorizations simplify analysis • provide information on specific aspects of forecast quality
general joint distribution • p(G[f],H[o]) : where G, H are mapping/transformation/operators that are applied to the variable values • morphing • filter • convolution • fuzzy • some methods perform mapping of o that is a function of f
general joint distribution • p(Gm[f],Hm[o]) : where Gm is a specific aspect/attribute/characteristic that results from the mapping operator • measures-oriented • compute some error measure or score that is a function of Gm[f],Hm[o] • MSE • what is the impact of these operators on the joint distribution?
Standardize terminology • “feature” – a distinct or important physical object that can be identified within meteorological data • “attribute” – a characteristic or quality of a feature, an aspect that can be measured • “similarity” – the degree of resemblance between features • “distance” – the degree of difference between features • others?
framework • follow Murphy (1993) and Murphy and Winkler (1987) terminology • joint distribution of forecast and observed features • goodness: consistency, quality, value
aspects of quality • accuracy: correspondence between forecast and observed feature attributes • single and/or multiple? • bias: correspondence between mean forecast and mean observed attributes • resolution • reliability • discrimination • stratification
Features-based process • Identify features FCST OBS
feature identification • procedures for locating a feature within the meteorological data • will depend on the problem/phenomena/user of interest • a set of instructions that can (easily) be followed/programmed in order for features to be objectively identified in an automated fashion
Features-based process • Characterize features FCST OBS
feature characterization • a set of attributes that describe important aspects of each feature • numerical values will be the most useful
How to determine false alarms/missed events? How to measure differences between objects? Features-based process • Compare features FCST OBS
feature comparison • similarity or distance measures • systematic method of matching or pairing observed and forecast features • determination of false alarms? • determination of missed events?
Features-based process • Classify features FCST OBS
classification • a procedure to place similar features into groups or classes • reduces the dimensionality of the verification problem • similar to going from a scatter plot to a contingency table • not necessary/may not always be used
How to match observed and forecast objects? = missed event dij = ‘distance’ between F i and O j O1 O3 Objects might “match” more than once… If d*j > dT : missed event O2 F1 …for each observed object, choose closest forecast object …for each forecast object, choose closest observed object If di* > dT then false alarm F2 = false alarm