Download
1 / 1
10 likes | 111 Views
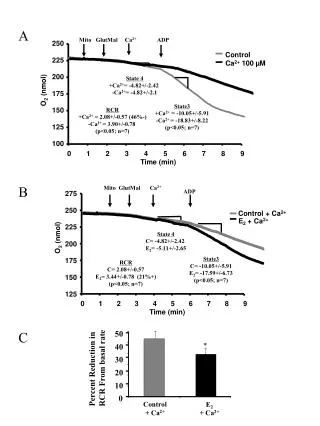
Investigating the impact of Calcium and E2 on mitochondrial respiration through RCR measurement, showcasing a 50% reduction in RCR with insights into metabolism.

E N D
50 * 40 30 Percent Reduction in RCR From basal rate 20 10 0 Control + Ca2+ E2 + Ca2+ A Mito GlutMal Ca2+ ADP 250 Control 225 Ca2+ 100 µM 200 State 4 +Ca2+= -4.82+/-2.42 -Ca2+= -4.82+/-2.1 O2 (nmol) 175 State3 +Ca2+ = -10.05+/-5.91 -Ca2+= -18.83+/-8.22 (p<0.05; n=7) RCR +Ca2+ = 2.08+/-0.57 (46%-) -Ca2+= 3.90+/-0.78 (p<0.05; n=7) 150 125 100 0 1 2 3 4 5 6 7 8 9 Time (min) B Mito GlutMal Ca2+ ADP 275 250 Control + Ca2+ E2 + Ca2+ 225 State 4 C= -4.82+/-2.42 E2= -5.11+/-2.65 O2 (nmol) 200 State3 C= -10.05+/-5.91 E2= -17.59+/-6.73 (p<0.05; n=7) 175 RCR C= 2.08+/-0.57 E2= 3.44+/-0.78 (21%+) (p<0.05; n=7) 150 125 0 1 2 3 4 5 6 7 8 9 Time (min) C


