Exploring Bivariate Statistics: Understanding Relationships between Random Variables
Discover the concept of covariance and correlation to analyze the connection between two random variables in statistical data. Learn how to detect linear relationships and conduct bivariate analysis using R-Studio for a deeper understanding.

Exploring Bivariate Statistics: Understanding Relationships between Random Variables
E N D
Presentation Transcript
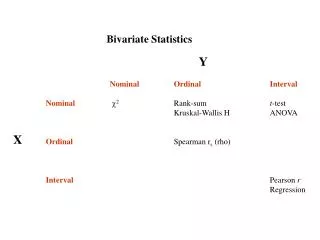
Are two random variables related to each other ? • What does it mean if the data are independent? • What is meant by the term covariance? • What does it mean when we say, two variables are correlated? Bivariate Statistics
Are two random variables related to each other ? Bivariate Statistics y=a*x The exact functional and deterministic form we find in mathematical functions is usually not what we find in observational data.
Are two random variables related to each other ? Bivariate Statistics Whereas mathematical functions give exact relationships between x and y, random noise in the real-world observations affects the processes and measurements. We want to know: Given the data, can we find a statistically significant relationship between x and y and what approximate functional form does it have. y=a*x ? y independent of x ?
Are two random variables related to each other ? Bivariate Statistics In this case, the small sample size and the large noise would not allow us to distinguish between a linear or non-linear (sqrt) relationship. Unless the scatter plot clearly suggests non-linear relationships, it is reasonable to start testing for linear relationships. In the following we will deal with the problem: How we can detect linear relationships between two random variables; and with what level of confidence? y=a*x ? y independent of x ?
R-Studio: close all open files • open class11b.R and immediately go to • menu ”File” • Save As and save a copy class12.R • The source code window in the upper left shows now the file is open under the name class12.R Bivariate Analysis: Correlation between tworandom variables
Mark lines 1-17 and run this part of the script (CTRL+ENTERor Menu Code -> Run line(s)) Bivariate Analysis: Correlation between tworandom variables First, we run the code lines listed in file scripts/loadano.R: This makes the function loadano() available to us. Then we use this function to read climate data from the files data/USW00014735_tavg_mon_mean_ano.csv data/USW00094728_tavg_mon_mean_ano.csv
Note that the function loadano() expects a list of parameters on the call: • station expects a string object to identify the station (e.g. “USW00014735”) • month expects a string object to select from the monthly mean data one specific month from each year. • start and date are used to limit the time range to certain years • This makes the function reusable with different station data • And one can select the month and years to conduct statistical the analysis on a subset of data Bivariate Analysis: Correlation between tworandom variables
Bivariate Analysis: Correlation between tworandom variables This is what R-Studio Environment should show listed Next line with actual code is line 25: 1 2 3 4 This function controls your Plotting window: it divides the plot area into 2x2 panels:
Bivariate Analysis: Correlation between tworandom variables What follows are 4 plot() function calls: Each new plot() function call starts a new subfigure in the 2x2 panel starting at the top left screen, going to the top right, then bottom left, and finally bottom right. Mark only these lines and run the code
Bivariate Analysis: Correlation between tworandom variables What follows are 4 plot() function calls: Each new plot() function call starts a new subfigure in the 2x2 panel starting at the top left screen, going to the top right, then bottom left, and finally bottom right. Mark only these lines and run the code
Bivariate Analysis: Correlation between tworandom variables What follows are 4 plot() function calls: Each new plot() function call starts a new subfigure in the 2x2 panel starting at the top left screen, going to the top right, then bottom left, and finally bottom right. Mark only these lines and run the code
Bivariate Analysis: Correlation between tworandom variables What follows are 4 plot() function calls: Each new plot() function call starts a new subfigure in the 2x2 panel starting at the top left screen, going to the top right, then bottom left, and finally bottom right. Mark only these lines and run the code
Class 12: Bivariate Analysis: Correlation between tworandom variables
The individual plots in window are rather small • We want to study relationships between two stations for only one selected month not twoat the same time. • Use more generic object names • Reduce the burden of manually adjusting the figure’s main title. • Add some more statistical output that measures the covariance and correlation Adjusting thE Code to our needs Note: Instructions to do so will be given in the class, the resulting code will be Available online as class12_completed.R