Bivariate Visualization
Explore associations between two attributes, analyze how variables change together, assess relationships, and distinguish data types. Learn methods like t-tests, contingency tables, and correlation in visualizing information.

Bivariate Visualization
E N D
Presentation Transcript
Bivariate Visualization CMSC 120: Visualizing Information 3/20/08
Types of Analysis Univariate • A single attribute • Characterize Observations • Number • Type • Similarity • Are two groups the same?
Comparing Two Groups • t-test (Normal Distributions) • Nonparameterics • Mann-Whitney U 175.00, p = 0.008 (A) (B)
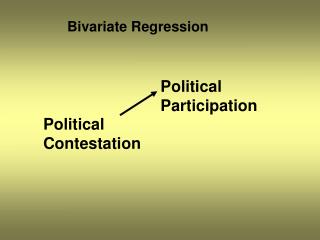
Types of Analysis Univariate Bivariate Two attributes Describe Associations How variables simultaneously change together Is there a relationship? What is the nature of the relationship? • A single attribute • Characterize Observations • Number • Type • Similarity • Are two groups the same?
Types of Data • Qualitative: pertaining to fundamental or distinctive characteristics • Nominal: unordered (e.g., names, types) • Ordinal: ordered (e.g., cold, warm, hot) • Quantitative: pertaining to an amount of anything • Discrete: isolated intervals • Continuous: unbroken, immediate connection
Types of Comparisons Continuous Discrete
Contingency Table • Contingency: dependent on chance • Represents number of observations that exhibit pairings of potential qualitative values (e.g., rainy and windy, sunny and dry)
Contingency Table: Example • Are certain types of organisms more or less likely to be threatened by extinction? • The data: biodiversity list of British Columbia • List of species • Two variates: organism type, risk assessment
Contingency Table: Example • Chi-Squared (χ2) test: are the values randomly distributed in the table cells?
One Way Analysis • Comparison of Means • ANOVA • Paired t-tests or other non-parametric test
Line Plot • Use when both values are continuous • Indicates a flow or connectedness from one point to another • Used to visualize a trend, or prevailing tendency • Time • Distance
Line and Scatter Plot • Use when at least one value is continuous • Indicates a flow or connectedness from one point to another • Scatter emphasizes that measurements are taken at discrete intervals
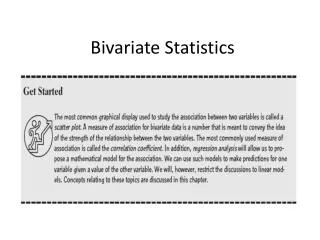
Scatter Plot • Can use whether data are discrete or continuous • Implies data are discrete • Used to visualize relationships • How two variables co-vary • How two variables are correlated • Describes a how a change in one variable is related to a change in another, but does not show a cause and effect
Covariation • Describes the degree of similarity between two variables (X, and Y) • Measure of how two variables vary together • If, when X is greater than its mean, Y tends to be greater than its mean, the covariance is positive • if, when X is greater than its mean, Y tends to be lesser, the covariance is negative • Units: units of X * units of Y
Correlation • Describes the degree of similarity between two variables (X, and Y) • Indicates strength and directionality of a linear relationship between X and Y • Departure of relationship from independence • No Units