Download
1 / 19
190 likes | 477 Views
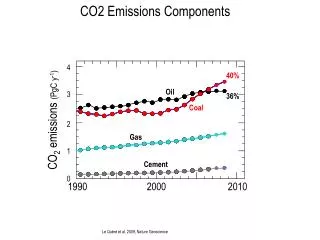
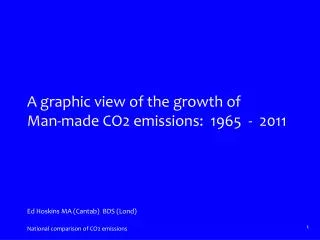
A graphic view of the growth of Man -made CO2 emissions: 1965 - 2011 Ed Hoskins MA ( Cantab ) BDS ( Lond ). World-wide CO2 emissions. A graphical presentation of a recent world-wide CO2 emission data set. The graphics are ogranised by nations and nation groups, giving results for:

E N D
A graphic view of the growth ofMan-made CO2 emissions: 1965 - 2011 Ed Hoskins MA (Cantab) BDS (Lond) National comparison of CO2 emissions
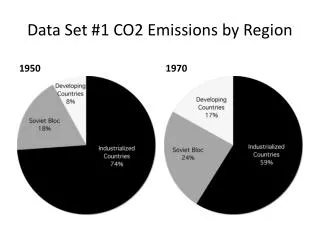
World-wide CO2 emissions A graphical presentation of a recent world-wide CO2 emission data set. The graphics are ogranised by nations and nation groups, giving results for: • the comparison of total CO2 emission levels • the progress of CO2 emissions/head. Information on worldwide National CO2 emission levels was published by BP from 1965 up until 2011. The data was well corroborated by previous datasets published by the Guardian and Google up until 2009 . National comparison of CO2 emissions
National grouping • China and Hong Kong with a population of more than 1.3 billion is the largest nation in the world. It has close to 10% GDP growth and is already the world’s largest CO2 emitter. China’s CO2 emissions overtook the USA in 2006, and since then they have now grown to be more than 50% greater CO2 emitters than the USA. The Chinese are major users of coal for electricity generation in the process of rapidly developing the prosperity of their vast nation. China has little or no current concern for their production of CO2 and its possible influence on climate. National comparison of CO2 emissions
National grouping • United States of America has rejected Cap and Trade legislation. At the same time the USA has achieved major reduction in CO2 emission by the use of shale gas for electricity generation. However under the current Obama administration the USA may well introduce stringent CO2 emission targets and further legislation obstructive to the use of fossil fuels via its Environmental Protection Agency. • Japan, the former Soviet Union and Canada are developed nations. They have already withdrawn from the now terminated Kyoto protocol as they consider any commitments to reduce their CO2 emissions to be an impediment to their continuing development and prosperity. National comparison of CO2 emissions
National grouping • Korea, Iran, South Africa, Mexico, Saudi Arabia, Brazil, Indonesia and Taiwan are rapidly developing nations. They are not interested in restricting their development by the control of CO2 emissions. • India is the second largest nation in the world with a population of about 1.2 billion and with GDP growth close to 9%. About a third of their population has no access to electricity. India is a major user of coal for electricity generation and they too have little or no concern for their production of CO2 and its possible influence on climate. Although India still has a comparatively low CO2 emissions/head, its rapidly advancing economic development has huge potential for further accelerated growth to approach the level of development of China. National comparison of CO2 emissions
National grouping • The other remaining 160+ under-developed nations are then grouped together. They are responsible for ~12% of the world’s CO2 emissions. Their rates of development are very variable but have potential for very substantial growth as their levels of development advance. This rapid advance is already being seen in the African and South American continents. • The European Union, Australia and New Zealand are isolated in having made legal commitments to CO2 reduction and continue in their efforts. New Zealand may now be considering withdrawal from the Kyoto protocol. National comparison of CO2 emissions
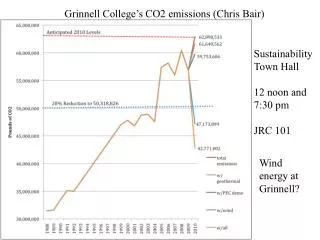
Current CO2 emissions Nations grouped according to CO2 emissions policies CO2 2011 pop 2011 CO2/head Committed EU (27) AU NZ 13.2% 7.6% 8.4 Not Joining-in USA 17.7% 4.5% 19.2 RU JP CA 13.1% 4.4% 14.6 China 26.7% 19.3% 6.9 India 5.3% 17.5% 1.5 KR IR ZA MX SA BR ID 10.9% 10.7% 5.4 Rest of World (200+ Nations) 13.2% 36.0% 1.6 Futility of Man-made Climate Control by limiting CO2 emissions