Download
1 / 1
10 likes | 178 Views
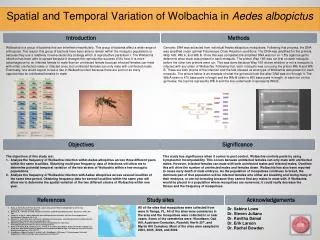
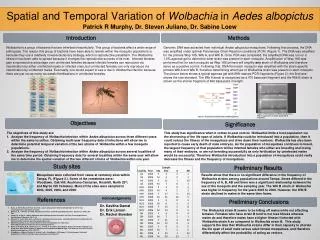
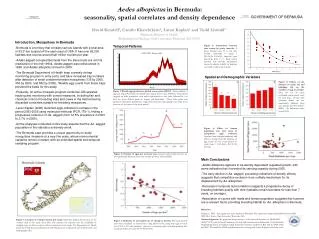
GOVERNMENT OF BERMUDA. Aedes albopictus in Bermuda: seasonality, spatial correlates and density dependence. David Kendell 1 , Camilo Khatchikian 2 , Laran Kaplan 2 and Todd Livdahl 2 1 Bermuda Ministry of Health 2 Department of Biology, Clark University, Worcester MA 01610.

E N D
GOVERNMENT OF BERMUDA Aedes albopictus in Bermuda: seasonality, spatial correlates and density dependence David Kendell1, Camilo Khatchikian2, Laran Kaplan2 and Todd Livdahl2 1Bermuda Ministry of Health 2Department of Biology, Clark University, Worcester MA 01610 • Introduction, Mosquitoes in Bermuda • Bermuda is a territory that consists various islands with a total area of 53.32 km located off the east coast of USA. It has over 65,000 habitats and receive around half million tourists per year. • Aedes aegypti occupied Bermuda from the slave trade era until its eradication in the mid-1960s. Aedes aegypti was rediscovered in 1998, and Aedes albopictus arrived in 2000. • The Bermuda Department of Health keep a weekly ovitrap monitoring program in entry ports, and have increased trap numbers after detection of small container breeder mosquitoes (135 by 2000, 300 by 2003, and 582 by 2005). Weekly egg counts from these traps provided the basis for this study. • Presently, an active mosquito program combines GIS assisted tracking and monitoring with control measures, including fish and chemical control of breeding sites and crews in the field removing discarded containers suitable for breeding mosquitoes. • Laran Kaplan (2006) identified eggs collected in ovitraps in the period 2003-2005 using molecular methods (PCR, ITS-1), finding a progressive reduction of Ae. aegypti (from 12.5% prevalence in 2003 to 3.7% in 2005). • All the analyses conducted in this study assume that the Ae. aegypti population in the islands is extremely small. • The Bermuda case provides a unique opportunity to study mosquitoes invasions at a very fine scale, where environmental variables remain constant, with an extended spatial and temporal sampling program. Temporal Patterns Figure 4: Correlations between sites counts by yearly intervals. Adecay function was fit to the data forcing y-intercept to equal 1 (R2=0.636, P<0.001). Intervals (time lags) range from 1 to 7. Such a decay function may provide information about the relative stability of habitats, a possibly useful control metric. Spatial and Demographic Variables Figure 5: Effects of the distance to roads (a) and buildings (b) on the number of egg in ovitraps. Data are for all years combined, using annual totals for each trap. Groups with common letters are not significantly different from one another (p>0.05, Tukey’s HSD). No differences were found in (b). Figure 1: Weekly egg production, pooled across years (2002-7). Mean number of eggs per trap, ±SE (based on residual mean square from 1-way ANOVA). This pattern suggests an early generation, with major reproduction in late June, followed bv a at least two more distinct peaks, in August and September. These latter peaks may represent subsequent generations. Eggs were found in traps during every week for at least one of the years of the study period. Figure 6: Effect of human population over total count of mosquitoes eggs collected. Quadrats were sampled randomly and without overlap from the database of egg counts for the entire period of study (Area = 0.25 Km2).(R2=0.113, P<0.05). Figure 2: Number of eggs per week per year. Groups with common letters are not significantly different from one another (p>0.05, Tukey’s HSD). • Main Conclusions • Aedes albopictus appears to be density dependent regulated growth, with some indication that it overshot its carrying capacity during 2005. • The early decline in Ae. aegypti, preceding indications of density effects, suggests that competitive exclusion is an unlikely mechanism for its displacement by Ae. albopictus. • Decrease in temporal autocorrelation suggests a progressive decay of breeding habitats quality with time (habitats remain favorable for less than 7 years, on average). • Association of counts with roads and human population suggests that humans are a relevant factor providing breeding habitat for Ae. albopictus in Bermuda. Reference: Kaplan, L. 2005. Aedes aegypti and Aedes albopictus in Bermuda: The spatial and temporal distribution from 2000-2005.M.A. thesis, Clark University, Worcester, MA. Overlay Acknowledgments: We appreciate the generosity of the National Institutes of Health (R15 AI062712-01) and the Keck Fundation, the help and fundamental collaboration of the Bermuda Health Department, the help provided by Clark’s University students in Biol 224, for 2004, 2005, and 2007. We thank Prof. Deborah Robertson for assisting with Laran Kaplan’s molecular work. Figure 1:Location of ovitraps used in this study. Solid dots indicate the location of the ovitraps used in this study (total 299). The criterion for selection was the availability of multiple years of data in order to allow comparisons to be made. The Department of Health keeps all ovitrap data georeferenced in GIS databases, in conjunction with infrastructure and demographic files. Figure 3: Response of per capita rate of change to density. Per capita growth rates were calculated as annual rates, using (lnNt+1/Nt), using total eggs for each site as N for all 1 km2 quadrats, chosen by overlaying a grid, excluding quadrats that contained bodies of water.R2=0.496, P<0.01