Download
1 / 1
10 likes | 155 Views
1 Geophysical Center of Évora and Physics Department, ECT, University of Évora , Portugal 2 University of Bari and Inter-Department Centre for the Evaluation and Mitigation of the Volcanic and Seismic Risk, Italy.

E N D
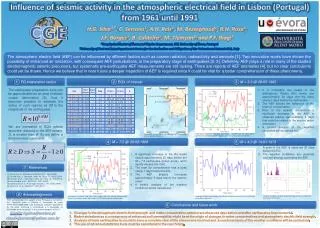
1Geophysical Center of Évora and Physics Department, ECT, University of Évora, Portugal 2University of Bari and Inter-Department Centre for the Evaluation and Mitigation of the Volcanic and Seismic Risk, Italy The atmospheric electric field (AEF) can be influenced by different factors such as cosmic radiation, radioactivity and aerosols [1]. Two innovative works have shown the possibility of enhanced air ionization, with consequent AEF perturbations, in the preparatory stage of earthquakes [2, 3]. Definitely, AEF plays a role in many of the studied electromagnetic seismic precursors, but systematic pre-earthquake AEF measurements are still lacking. There are reports of AEF anomalies [4], but no clear conclusions could yet be drawn. Hence we believe that in near future a deeper inspection of AEF is required since it could be vital for a better comprehension of these phenomena. Influence of seismicactivity in the atmosphericelectricalfield in Lisbon (Portugal) from 1961 until 1991 2. EQ’s of interest 3. M = 3.3 @ 08/05/1962 1. EQ preparation radius The earthquake preparation zone can be approximated as an area of elastic crustal deformation [5], thus it becomes possible to estimate the radius of such regions as (M is the magnitude of the earthquake): It is noticeable two peaks of the atmospheric Radon (Rn) levels one approximately 20 days and the other nearly 2 days before the earthquake. The AEF follows the behaviour of the total ion concentration. Prior to the seismic occurrence a significant decrease in the AEF is observed lasting approximately 4 days that could be related to the second radon emanation. A careful analysis of the weather conditions will be carried out. AEF sensor M = 4.3 @ 14/01/1973 M = 3.3 @ 08/05/1962 M = 4.5 @ 24/02/1969 M = 7.5 @ 28/02/1969 We are interested in EQ’s whose epicentre distance to the AEF sensor, D, is smaller than R. So we define a dimensionless parameter: H.G. Silva1,*, C. Serrano1, A.H. Reis1, M. Bezzeghoud1, R.N. Rosa1, J.F. Borges1, B. Caldeira1, M. Tlemçani1 and P.F. Biagi2 Atmospheric electrical field (blue line), Radon (red line) and ion concentration (green line) 30 days before after the M = 3.3 EQ that occurred at 08/05/1962. Seismicity of the south of Portugal for the period 01/01/1961–31/12/2010. 4. M = 7.5 @ 28/02/1969 5. M = 4.3 @ 14/01/1973 A peak in the AEF is observed 20 days before the EQ. The weather conditions are generally bad and strongly perturbing the AEF. A significant increase in the Rnlevels occurs approximately 25 days before the M = 7.5 earthquake (green arrow), wicht rapidly decays aftethart. The total ion concentration has a peak nearly 7 days before the EQ. The AEF sharply increases approximately 5 days before the seismic event. A careful analysis of the weather conditions will be carried out. 7. References [1] Serrano et al., Atmospheric Research 81, 236 (2006). [2] Freund et al., J. Atmosph. Solar-Ter. Phys. 71, 1824 (2009). [3] Harrison et al., J. Atmosph. Solar-Ter. Phys. 72, 376 (2010). [4] Kachakhidzeet al., NHESS 9, 1221 (2009). [5] Dobrovolskyet al., Pure Appl. Geophys. 117, 1025 (1979). [6] Silva H.G. et al., NHESS 11, 987 (2011). 8. Acknowledgments Weather conditions 30 days before and after the M = 4.3 EQ that occurred at 14/01/1973. Atmospheric electrical field (blue line), Radon (red line) and ion concentration (green line) 30 days before after the M = 7.5 EQ that occurred at 28/02/1969. Atmospheric electrical field (blue line) 30 days before and after the M = 4.3 EQ that occurred at 14/01/1973. HGS acknowledges the support of two Portuguese institutions: the Fundaçãopara a Ciência e Tecnologia for grant SFRH/BPD/63880/2009, and FundaçãoCalousteGulbenkianfor the price “EstímuloàCriatividade e àQualidadenaActividade de Investigação” in the science program of 2010. 6. Conclusions and future work • Changes in the atmospheric electric field strength and radon concentration patterns are observed days before and after earthquakes have occurred. • Radon emissions as a consequence of enhanced soil permeability might be at the origin of changes in radon concentrations and atmospheric electric field strength. • Analysis of more earthquakes is crucial to have a complete view of the phenomena involved and a careful analysis of the weather conditions will be carried out. • The use of advanced statistics tools must be considered in the near future. Emails: hgsilva@uevora.ptclaudiafserrano@yahoo.com.br