Download
1 / 15
150 likes | 162 Views
This article explores the transformation of insurance ratings over the decades, starting from simple ratios in the 1980s to the advent of complex models in the 1990s and beyond. It highlights the factors considered in the rating process and the challenges faced in communicating the benefits of more sophisticated methodologies. The emphasis on capital, bond default rates, and economic assumptions is examined, along with the importance of training, consistency, efficiency, and accuracy in the rating process.

E N D
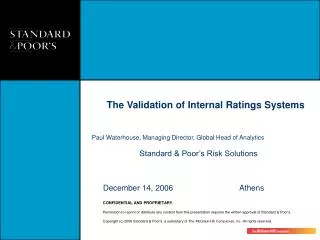
DFA vs. the Rating ProcessSteve DreyerManaging DirectorStandard & Poor’s
Insurance Ratings: 1980’s Simple, Static Ratios “Non-Directed” Judgement
1980’s: Simple Ratios TestStandard Premiums / Surplus ……….. less than 3 times Combined Ratio …………… less than 110% Reserves / Surplus …………. less than 3 times Return on Assets …………… above 100 b.p.
1980’s: Analytical Factors Management Liquidity BusinessReview Capital Industry Risk FinancialFlexibility Earnings
Insurance Ratings: 1990’s Compound Ratios More “Directed” Judgement Quantitative Ratings
1990’s: Invasion of the Models Capital Model Reserve Model Liquidity Model Earnings Model MBS Model Cat Risk Model
ROA vs. EAR AAA 23 > 100 b.p. AA 36 > 100% A BBB Top 50 Life Insurers
1990’s: Analysts Weight Factors Company“A” Company“B”
Insurance Ratings: 2000’s IntegratedModels Fully Focused Judgement
Economic Assumption Sets Industry Conditions Company Ratings
Differences in DFA Application S&PInsurer PurposeEvaluateExperiment InformationSummarizedDetailed EmphasisCapital Assorted
Bond Default Rates CCC B BB A BBB AA /AAA
Caveats... CompoundErrors Complexity Communicating
Benefits... Training Consistency Efficiency Clarity Accuracy