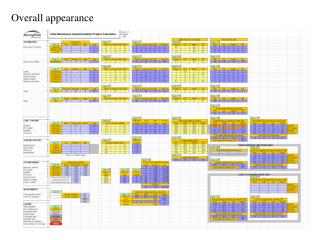
Overall appearance
Overall appearance. Heading text appears against a pale orange background. Conventions used. Table labels are pale green and have an associated comment describing the table. Enter data into light blue areas. An orange background is used to draw attention to important data.

Overall appearance
E N D
Presentation Transcript
Heading text appears against a pale orange background Conventions used Table labels are pale green and have an associated comment describing the table. Enter data into light blue areas An orange background is used to draw attention to important data Parameter values used in calculations appear in cream areas Calculated data appears in medium blue areas
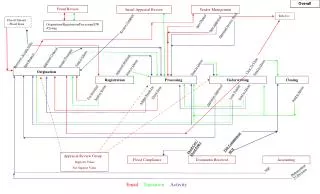
Functional layout Convert general notional units to notional units for each core work type Enter counts of items that drive work volume Convert counts to general notional units of work Enter core staff levels Convert notional to actual work Calculate phase durations and FTE by work type Rate scaling factors Convert to scale value Apply scale values Phase duration limit adjustment work area Enter charge rates Summary of time, costs, rates and phase durations FTE override adjustment work area Adjustment switches
Parameters that specifiy the level of work effort for each core role for each work effort driver in area A Parameters that specify notional work units for each count in area A Input area for volumes (counts) of items that drive work effort Calculation area that converts counts in area A to notional work units via parameters in area B Calculation of notional core work effort - detail E=CxD C=AxB A B C D E TOTAL TOTAL TOTAL Calculation area that converts notional work units in area C to notional work units per core role via parameters in area D
Conversion of notional core work effort to actual effort - context
Calculation of notional core work effort - detail Parameters that specify notional work effort to actual work effort conversion for each core role and skill level C=notional x weighted(AxB) A B C TOTAL Calculation area that converts core notional work units to actual days of effort per core role using the resources specified in area A via parameters in area B Input area for core resource numbers by skill level
Calculation area that determines the elapsed days for each phase for each core role by applying the work profiles in area A to the actual work effort Project duration and FTE calculation - detail C = Resources x B(detail) / B(max) B C A TOTAL MAX B = Actual x A Parameters that specify the profile of work effort for each core role across the project phases Calculation area that determines the FTE for each phase for each core role by considering the core resources and phase durations