Understanding Spectroscopy: Preparation and Applications in Chemical Analysis
This presentation covers essential concepts of spectroscopy, including the preparation of solutions, Beer’s Law, and the functionality of spectrometers. It emphasizes the importance of understanding light absorption by solutions and how different wavelengths affect the color we perceive. You'll learn how to accurately prepare solutions of known concentration and how to apply spectroscopic methods for chemical analysis. This includes practical exercises involving transmittance and absorbance, ensuring a solid grounding in the principles of spectroscopy for effective laboratory work.

Understanding Spectroscopy: Preparation and Applications in Chemical Analysis
E N D
Presentation Transcript
Spectroscopy • In addition to this presentation, before coming to lab or attempting the prelab quiz you must also: • Read the introduction to the lab in the coursepack • Review preparation of solutions * solutions of known molarity (pg 146, Brown et al.) * solutions by dilution (pp 148-150 Brown et al.) • Familiarize yourself with spectrometers * read pp. 65-67 in Stanitski et al.
What’s the point? • Review the relationship between color and wavelength • Learn an application of spectroscopy to chemical analysis • Become familiar with Beer’s Law: the relationship between light absorption and solution concentration • Gain practice in accurate solution preparation
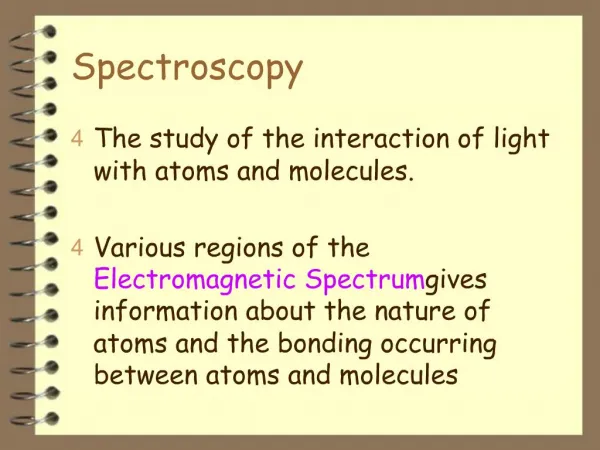
Background When light passes through a solution, some of it can be lost to absorption. This decreases the power of the transmitted beam (PT) relative to the incident beam (P0). The amount of absorption usually depends on the wavelength of the light: some colors are transmitted and others aren’t.
Visible UV IR Absorbance It looks blue because red light is absorbed between 550 and 700 nm. Blue is transmitted through the solution Red and yellow are absorbed Spectrum and Spectrometers • A plot of absorbance versus l is an absorbance spectrum • each substance has a unique absorbance spectrum This is a spectrum of methylene blue, a dye used in microscopy. The light absorbed below 400 nm does not affect the color, because we can’t see those wavelengths.
detector sample electronics display selector Spectrometers • Spectrometers are used to measure spectra • Spectrometers performs two functions • allow wavelength selection of the light • detect & report the light intensity
The spectrum can be viewed here as a plot or a table of numbers The sample, contained in a cuvette, goes in this compartment Genesys 10 Spectrometer Our spectrometers look like this.
The absorbance is calculated from T A = -log(T)why bother with this? Transmittance Spectometers measure the transmittance (T) P0 = incident light intensity PT = transmitted light intensity T = (PT / P0) This is a fraction. It is often reported as a % % T = T x 100%
Beer’s Law • Also called the Beer-Lambert law • Relates absorbance and concentration A = a b C • a = absorption coefficient physical property, unique to each substance determines the intensity of absorbance magnitude depends on wavelength • b = sample optical pathlength (width of cuvette) • C = solution concentration
Slope = A / C = ab Absorbance concentration Beer’s Law Plots A = a b C • Follows the equation of a straight line y is absorbance and x is concentration The slope is (ab) and the y-intercept should be 0 A plot of A versus C is called a Beer’s Law plot
Measure A for an unknown Uses of Beer’s Law Plots • Used to find absorption coefficients see previous slide • If you know a and b, can use a Beer’s Law plot to find C of an unknown • Create B-L plot Absorbance • Find C from plot concentration
Summary of Relationships Transmittance and Absorbance T = (PT / P0) A = -log(T) All the light is transmitted Half the light is transmitted None of the light is transmitted Absorbance and Concentration A = abC use to find a by measuring A when C is known use to find C by measuring A when a is known
Sample Calculations Preparing Solutions of Known Concentration What mass of sodium chloride is required to make 50.0 mL of a 0.825 M solution? Find required moles NaCl, then mass 0.825 mol x 0.0500 L = 0.0413 mol 1 L 0.0413 moles x 58.44 g = 2.41g NaCl 1 mol
To prepare this solution • Place 2.41 g of NaCl in a 50 mL volumetric flask • Add some water to dissolve the NaCl • Add DI to dilute to 50.00 mL, then mix thoroughly
(0.25 M)(0.0500 L) V1 = (1.0 M) Sample Calculation Preparing Solutions by Dilution What volume of a 1.00 M solution is required to prepare 50.0 mL of a 0.250 M solution? How many moles are in 50.0 mL of a 0.25 M solution? (0.250 M)(0.0500 L) = 0.0125 mol What volume of a 1.0 M solution will deliver this? (0.0125 M) / (1.00 M) = 0.0125 L OR 12.5 mL This is the same as M1V1 = M2V2: M1 = 1.00 M V1 = ? M2 = 0.250 M V2 = 50.0 mL
Safety and Preparation • Carefully read the instructions for solution preparation in the lab (part II). It is trickier than you think, and you need to come prepared. • Review the spectrometer instructions (pg. 40). • Goggles and coat must be on at all times. • Wash hands if solutions spill on you. • Solutions can be disposed of down drain.