Download
1 / 31
320 likes | 715 Views
Environmental Product Design – Example: Access, Mobility, Vehicles 60/51 13/18 Example: Reducing the Greenhouse Gas Emissions from Motor Vehicles US Greenhouse Gas Emissions by Sector (in million metric tons) Source: US Emission Inventory 2005, EPA

E N D
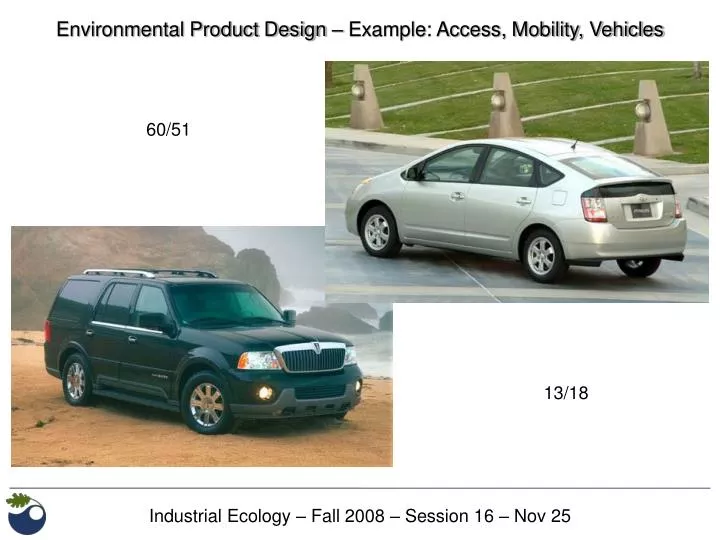
Environmental Product Design – Example: Access, Mobility, Vehicles 60/51 13/18
Example: Reducing the Greenhouse Gas Emissions from Motor Vehicles US Greenhouse Gas Emissions by Sector (in million metric tons) Source: US Emission Inventory 2005, EPA
Example: Reducing the Greenhouse Gas Emissions from Motor Vehicles US CO2 emissions from transportation vs. total (in MMT) 32.3% 27.6% Source: http://www.eia.doe.gov/
Example: Reducing the Greenhouse Gas Emissions from Motor Vehicles
Example: Reducing the Greenhouse Gas Emissions from Motor Vehicles
Light-Duty Automotive Technology and Fuel Economy Trends Source: US EPA (2003) Light-Duty Automotive Technology and Fuel Economy Trends
Pressure to reduce GHG emissions from vehicles is increasing: • European Union • Goal: Average of 120 g CO2 per km driven for passenger cars by 2015 • 1999/2000: Voluntary agreements with car manufacturers • 2007/2008 : Conversion into binding regulation • California - Assembly Bill 1493 • Goal: Average of 127 g CO2eq per km driven for passenger cars by 2016 • 2002: AB 1493 passes Assembly and Senate • 2004: AB 1493is approved by Governor • New York State • 2005: Official proposal to adopt California’s regulation • Canada • 2005 Voluntary agreements with car manufacturers Agreements / regulations do not use a full life cycle perspective
Typical life cycle GHG emissions of a passenger car: Total: Compact ~ 50 tonnes of CO2 eq Midsize ~ 60-70 tonnes of CO2 eq SUV ~ 80+ tonnes of CO2 eq 5-15 % 4-5 % 80-90 % 0-1 % Vehicle GHG reduction strategies focus on the use phase
There are many ways to reduce use phase GHG emissions of vehicles: • Power train modifications: HEV, FCV, BEV • Engine modifications: Variable valve timing and lift, cylinder shut-off • Fuel combustion modifications: Turbocharger, CVR, direct injection • Transmission modifications: Continuously variable transmission, shifting schedules • Alternative fuels: Biodiesel,ethanol, hydrogen • Reduction of aerodynamic drag: Body shape • Reduction ofrolling resistance: Tires • Vehicle mass reduction: Smaller vehicles, better packaging, light-weight materials
Life cycle GHG emissions: ICEV versus HEV Average lifecycle GHG (in kg CO2eq) emissions of a Civic Hybrid (HEV) and a Civic LX (ICEV) Source: Bren Group Project on HEV (Class of 2005) (Average for manual and automatic transmission)
Energy efficiencies of ICEV, HEV, BEV, FCV Internal combustion engine vehicle (ICEV) : Fuel productionand delivery ICE, powertrain friction 0.88 x 0.16 = 0.14 Hybrid electric vehicle (HEV): Fuel productionand delivery Electric motor, ICE, battery powertrain friction 0.88 x 0.32 = 0.28 Battery electric vehicle (BEV): Power plant Electricity transmission Battery Electric motor, powertrain friction 0.35 – 0.55 x 0.93 x 0.8 x 0.8 = 0.2 – 0.33 Fuel cell vehicle (FCV): Compression, transmission Fuel cell Electric motor, powertrain friction Reformation 0.8 x 0.75 x 0.5 x 0.8 = 0.24
Primary energy efficiencies of ICEV, HEV, BEV, FCV Energy content of gasoline: 46.7 MJ per kg Energy content of hydrogen: 141.9 MJ per kg
What are Biofuels? • Fuels derived from biological sources are called biofuels. • Examples are: • Grains, sugar crops and other starches can be fermented into ethanol, which can be burnt pure or blended with conventional gasoline. • Cellulosic material, including grasses, trees and green waste, can also be converted into alcohol. • Oil-seed crops (e.g. rapeseed, soybean and sunflower) can be converted into methyl esters, which can be burnt pure or blended with conventional diesel. • Other organic wastes with high calorific content, like waste oil, animal manure, organic household waste
Global production of fuel ethanol, 1975-2003(in million liters per year) Source: International Energy Agency, 2004
Global production capacity of biodiesel, 1991-2003(in million liters per year) Source: International Energy Agency, 2004
Ethanol production Harvest Technique Feedstock Conversion Process Heat Sugar Conversion Co-Products Feedstock Fermentation & distillation of alcohol Sugarcane Cut wholecane stalk Crush cane,heat, treatchemically Mainlycrushedcane Heat, electricity,molasses Separatestarch, mill, applyenzymes Graincrops Take starchy parts only, leave stalks Mainlyfossilfuel Animalfeed, sweetener Harvestentireplant Cellulosiccrops Heat,electricity,animal feed,bioplastic,etc. Convert tosugar viaenzymatic hydrolysis Mainly lignin &cellulose Wastebiomass Collect,separate,clean
Range of estimated GHG reductions from biofuels (well-to-wheels CO2eq compared to gasoline/diesel) Biodiesel from soy +44% E90 from corn -2% E90 from grass -44% Source: International Energy Agency, 2004 Source: Delucchi, ITS UC Davis, 2006
Trade-off across life cycle stages due to material substitution: Reducing automotive GHG emissions through lightweight materials
The Impact of Material Choice on GHG Emissions from Vehicles Greenhouse Gases Materials Production Vehicle Manufacturing Vehicle Use Vehicle Disposal Material Choice Need for Life Cycle Assessment
GHG emissions from material production MaterialEstimatedGHG Emissions (in kg CO2eq / kg of material) Primary Production Secondary Production Steel *) 2.3 – 2.7 0.7 – 1.0 AHSS *) 2.3 – 2.7 0.7 – 1.0 Aluminum *) 13.9 – 15.5 1.4 – 2.0 Magnesium 18 – 42 recycled with aluminum GFRP 2.5 – 8.3 – CFRP 9.5 – 23 – *) inventory data from 1999/2000 Sources: IISI (2000), ISI (2000), Li (2004), Ramakrishnan & Koltun (2004), Tharumarajah & Koltun (2007), Dhingra et al. (2001), Ashby (2005)
Vehicle mass savings • Material choice • Vehicle design • Power train efficiency • Driving cycle • Total mileage Fuel savingsper mass savings GHG emissionsper liter of fuel • Fuel type • Production pathway Relationship between material choice and use phase GHG emissions Rolling resistance Aerodynamic drag Gravity Acceleration
Material choice and vehicle design Power train efficiency, driving cycle, total mileage Fuel type and production pathway Calculation of GHG reductions during vehicle use phase Secondary mass savings Material replacement coefficient Replaced material Energy savings per mass savings Total distance driven during use phase Well-to-wheels (WTW) GHG emissions of fuel
Energy savings per mass savings ES Power traintype Driving cycle Power trainadjustment Midsize vehicle Sources: Forschungsgesellschaft Kraftfahrwesen Aachen (FKA) 2006
Different types of driving cycles New European driving cycle (NEDC)
vehicle life cycle Primary production Vehiclemanufacturing Vehicleuse Vehicle end-of-life management Secondary production Material recycling in attributional LCA Allocate elementary flows to scrap inputs and outputs Scrap use is accounted for in the recycled content method,but ignored in the avoided burden method Generation and recycling of scrap isignored in the recycled content method,but accounted for in the avoided burdenmethod
Material Recycling: Recycled Content vs. Avoided Burden Recycled Content (no allocation) Avoided Burden 22MJ/kg 1 A Prim 10MJ/kg Sec 0.75 0.25 B Prim Sec 0.75 0.25 C Prim 1
The Impact of Material Choice on GHG Emissions from Vehicles Materials Production Vehicle Manufacture Vehicle Use Vehicle End of Life CO2eq end-of-life recycling vehicle use Total mileage material production TM
Reading for Tuesday, 2 December:Nokia (2005) IPP Pilot Project – Stage II Final Report: Options for Improving Life Cycle Environmental Performance of Mobile Phones(posted on course website as Nokia 2005)Due date for 4th Assignment: Thursday, December 4(assignment is posted on course website)