Download
1 / 12
140 likes | 647 Views
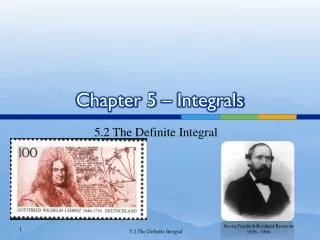
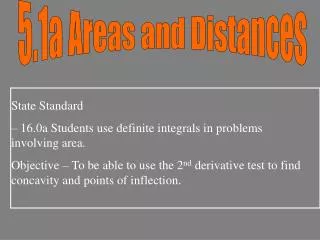
Chapter 5 Integrals 5.1 Areas and Distances. In this handout: The Area problem Area under a Parabola Definition of the Area The Distance problem. y = x 2. 0. 1. The Area Problem.

E N D
Chapter 5 Integrals5.1 Areas and Distances In this handout: The Area problem Area under a Parabola Definition of the Area The Distance problem
y=x2 0 1 The Area Problem Consider the problem of determining the area of the domain bounded by the graph of the function x2, the x-axis, and the lines x=0 and x=1. We determine the area by approximating the domain with thin rectangles for which the area can be directly computed. Letting these rectangles get thinner, the approximation gets better and, at the limit, we get the area of the domain in question. As the number n of the approximating rectangles grows, the approximation gets better.
Height of the kth rectangle. Length of the bottom. Let A denote the actual area of the domain in question. Clearly sn<A for all n. Lower est. sn Upper est. Sn
This can be computed directly using a previously derived formula for the sum of squares. Solution follows.
y=x2 0 1 Conclude The blue area under the curve y=x2 over the interval [0,1] equals 1/3.
Definition of Area Generalizing from the previous example, we have the following definition. The areaA of the region S under the graph of the continuous function f is the limit of the sum of the areas of approximating rectangles: Note that instead of using left endpoints or right endpoints, we could take the height of the ith rectangle to be the value of f at any number xi* in the subinterval [xi-1, xi]. That number is called a sample point.
The Distance Problem velocity time Consider an object moving at a constant rate of 3 ft/sec. Since rate . time = distance: 3t = d If we draw a graph of the velocity, the distance that the object travels is equal to the area under the line. After 4 seconds, the object has gone 12 feet.
Approximate area: If the velocity is not constant, we might guess that the distance traveled is still equal to the area under the curve. Example: We could estimate the area under the curve by drawing rectangles touching at their left corners.
Approximate area: We could also estimate the area under the curve by drawing rectangles touching at their right corners.
Approximate area: Another approach would be to use rectangles that touch at the midpoint. In this example there are four subintervals. As the number of subintervals increases, so does the accuracy.
Approximate area: The exact answer for this problem is . With 8 subintervals: width of subinterval
Measuring the distance • In general, suppose an object moves with velocity v=f(t), where a ≤ t ≤ b and f(t)≥0. • Take velocity readings at times t0 (=a), t1 , …, tn (=b) so that the velocity is approximately constant on each subinterval. • The time between consecutive readings is Δt = (b-a)/n. • Then the exact distance d traveled is