Download
1 / 14
140 likes | 421 Views
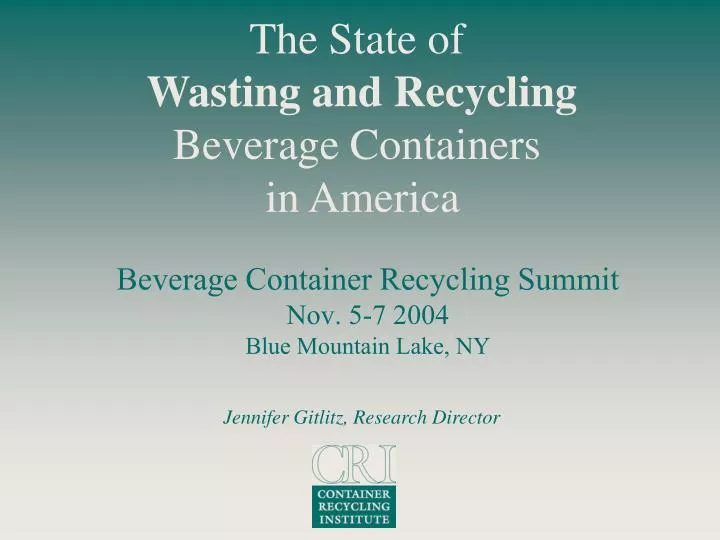
The State of Wasting and Recycling Beverage Containers in America Beverage Container Recycling Summit Nov. 5-7 2004 Blue Mountain Lake, NY Jennifer Gitlitz, Research Director U.S. Beverage Container Recycling Rates 1990-2003 U.S. Beverage Container Recycling Rates 1990-2003

E N D
The State of Wasting and Recycling Beverage Containers in America Beverage Container Recycling SummitNov. 5-7 2004Blue Mountain Lake, NY Jennifer Gitlitz, Research Director
U.S. Beverage Container Recycling Rates 1990-2003 © Container Recycling Institute, 2004
U.S. Beverage Container Recycling Rates 1990-2003 © Container Recycling Institute, 2004
U.S. Beverage Container Recycling Rates 1990-2003 © Container Recycling Institute, 2004
U.S. Beverage Container Recycling Rates 1990-2003 © Container Recycling Institute, 2004
Apparent Paradox: Growing Curbside Recycling, Shrinking Recycling Rate 2002: 8,875 curbside programs 139 million people served 49% of U.S. population 1990: 2,711 curbside programs 37 million people served 15% of U.S. population © Container Recycling Institute, 2004
Beverage Containers Sold, Recycled and Wasted in the U.S., 1990-2003 Sales: 42% increase Wasting: 87% increase Recycling: 3% decrease © Container Recycling Institute, 2004
Reasons for the Increase in Beverage Container Waste • Growth in beverage sales (units sold) • Growth in sales of “new age” beverages not covered by existing deposit laws (except in Maine & CA) • Increase in away-from-home consumption • Increase in contamination of recyclables collected through curbside recycling--esp. glass • Declining value of nickel deposit in bottle bill states and declining value of scrap aluminum cans in non-bottle bill states © Container Recycling Institute, 2004
Composition of U.S. PET Bottles Available for Recycling, 1999-2002 Note: Carbonated Soft Drink (CSD) percentage plus Custom Container percentage adds up to 100%. iPET (individual) includes both CSD and Custom. Source: NAPCOR, Oct. 2004. © Container Recycling Institute, 2004
U.S. PET Bottled Water Sales (billions of units) © Container Recycling Institute, 2004
Beverage Container Recycling/Redemption Rates in Selected Deposit States and Nationally, 1990 - 2003* © Container Recycling Institute, 2004
Declining Value of a Nickel: 1971–2001 Chart derived from Consumer Price Index © Container Recycling Institute, 2004
Keeping pace with inflation: Hypothetical deposit value based on a 1971 nickel © Container Recycling Institute, 2004
U.S. Beverage Container Recycling Rates 1990-2003 © Container Recycling Institute, 2004