Measures of Association in Biostatistics
Explore absolute vs. relative risk, attributable risk, population attributable risk, and number needed to treat. Learn how biostatisticians contribute to medical research and the various applications of biostatistics. Understand different types of data and measures of association in studies.


Measures of Association in Biostatistics
E N D
Presentation Transcript
Measures of Association • Absolute risk • The relative risk and odds ratio provide a measure of risk compared with a standard. • Attributable risk or Risk difference is a measure of absolute risk. It represents the excess risk of disease in those exposed taking into account the background rate of disease. The attributable risk is defined as the difference between the incidence rates in the exposed and non-exposed groups. • Population Attributable Risk is used to describe the excess rate of disease in the total study population of exposed and non-exposed individuals that is attributable to the exposure. • Number needed to treat (NNT) • The number of patients who would need to be treated to prevent one adverse outcome is often used to present the results of randomized trials.
Relative Values As a result of statistical research during processing of the statistical data of disease, mortality rate, lethality, etc. absolute numbers are received, which specify the number of the phenomena. Though absolute numbers have a certain cognitive values, but their use is limited.
Relative Values In order to acquire a level of the phenomenon, for comparison of a parameter in dynamics or with a parameter of other territory it is necessary to calculate relative values (parameters, factors) which represent result of a ratio of statistical numbers between itself. The basic arithmetic action at subtraction of relative values is division.
In medical statistics themselves the following kinds of relative parameters are used: • Extensive; • Intensive; • Relative intensity; • Visualization; • Correlation.
The extensive parameter, or a parameter of distribution, characterizes a parts of the phenomena (structure), that is it shows, what part from the general number of all diseases (died) is made with this or that disease which enters into total.
The role of Biostatisticians Biostatisticians play essential roles in designing studies, analyzing data and creating methods to attack research problems as diverse as • determination of major risk factors for heart disease, lung disease and cancer • testing of new drugs to combat AIDS • evaluation of potential environmental factors harmful to human health, such as tobacco smoke, asbestos or pollutants
Applications of Biostatistics • Public health, including epidemiology, health services research, nutrition, and environmental health • Design and analysis of clinical trials in medicine • Genomics, population genetics, and statistical genetics in populations in order to link variation in genotype with a variation in phenotype. This has been used in agriculture to improve crops and farm animals. In biomedical research, this work can assist in finding candidates for gene alleles that can cause or influence predisposition to disease in human genetics • Ecology • Biological sequence analysis
Applications of Biostatistics Statistical methods are beginning to be integrated into • medical informatics • public health informatics • bioinformatics
Types of Data • Categorical data: values belong to categories • Nominal data: there is no natural order to the categories e.g. blood groups • Ordinal data: there is natural order e.g. Adverse Events (Mild/Moderate/Severe/Life Threatening) • Binary data: there are only two possible categoriese.g. alive/dead • Numerical data: the value is a number(either measured or counted) • Continuous data: measurement is on a continuume.g. height, age, haemoglobin • Discrete data: a “count” of events e.g. number of pregnancies
Measures of Frequency of Events • Incidence • The number of new events (e.g. death or a particular disease) that occur during a specified period of time in a population at risk for developing the events. • Incidence Rate • A term related to incidence that reports the number of new events that occur over the sum of time individuals in the population were at risk for having the event (e.g. events/person-years). • Prevalence • The number of persons in the population affected by a disease at a specific time divided by the number of persons in the population at the time.
Measures of Association • Relative risk and cohort studies • The relative risk (or risk ratio) is defined as the ratio of the incidence of disease in the exposed group divided by the corresponding incidence of disease in the unexposed group. • Odds ratio and case-control studies • The odds ratio is defined as the odds of exposure in the group with disease divided by the odds of exposure in the control group.
Measures of Association • Absolute risk • The relative risk and odds ratio provide a measure of risk compared with a standard. • Attributable risk or Risk difference is a measure of absolute risk. It represents the excess risk of disease in those exposed taking into account the background rate of disease. The attributable risk is defined as the difference between the incidence rates in the exposed and non-exposed groups. • Population Attributable Risk is used to describe the excess rate of disease in the total study population of exposed and non-exposed individuals that is attributable to the exposure. • Number needed to treat (NNT) • The number of patients who would need to be treated to prevent one adverse outcome is often used to present the results of randomized trials.
Terms Used To Describe The Quality Of Measurements • Reliability is variability between subjects divided by inter-subject variability plus measurement error. • Validity refers to the extent to which a test or surrogate is measuring what we think it is measuring.
Measures Of Diagnostic Test Accuracy • Sensitivity is defined as the ability of the test to identify correctly those who have the disease. • Specificity is defined as the ability of the test to identify correctly those who do not have the disease. • Predictive values are important for assessing how useful a test will be in the clinical setting at the individual patient level. Thepositive predictive valueis the probability of disease in a patient with a positive test. Conversely, the negative predictive valueis the probability that the patient does not have disease if he has a negative test result. • Likelihood ratioindicates how much a given diagnostic test result will raise or lower the odds of having a disease relative to the prior probability of disease.
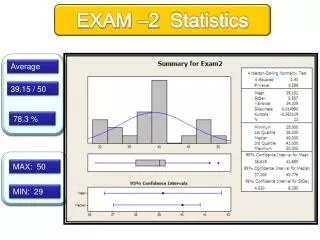
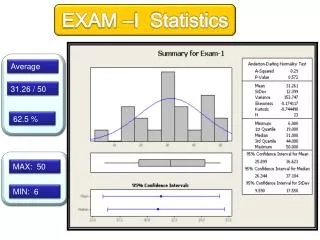
Expressions Used When Making Inferences About Data • Confidence Intervals • The results of any study sample are an estimate of the true value in the entire population. The true value may actually be greater or less than what is observed. • Type I error (alpha) is the probability of incorrectly concluding there is a statistically significant difference in the population when none exists. • Type II error (beta) is the probability of incorrectly concluding that there is no statistically significant difference in a population when one exists. • Power is a measure of the ability of a study to detect a true difference.
Percentage of Specimens Testing Positive for RSV (respiratory syncytial virus)
The Normal Distribution . • Mean = median = mode • Skew is zero • 68% of values fall between 1 SD • 95% of values fall between 2 SDs Mean, Median, Mode 2 1
Types of Errors Truth Conclusion Power = 1-
Using this parameter, it is possible to determine the structure of patients according to age, social status, etc. It is accepted to express this parameter in percentage, but it can be calculated and in parts per thousand case when the part of the given disease is small and at the calculation in percentage it is expressed as decimal fraction, instead of an integer.
The general formula of its calculation is the following: part × 100 total
The intensive parameter characterizes frequency or distribution. • It shows how frequently the given phenomenon occurs in the given environment. • For example, how frequently there is this or that disease among the population or how frequently people are dying from this or that disease. • To calculate the intensive parameter, it is necessary to know the population or the contingent.
General formula of the calculation is the following: phenomenon×100 (1000; 10 000; 100 000) environment
General mortality rate number of died during the year × 1000 number of the population
Parameters of relative intensity represent a numerical ratio of two or several structures of the same elements of a set, which is studied. • They allow determining a degree of conformity (advantage or reduction) of similar attributes and are used as auxiliary reception; in those cases where it isn’t possible to receive direct intensive parameters or if it is necessary to measure a degree of a disproportion in structure of two or several close processes.