
Uploaded by
qamar
4 SLIDES
190 VIEWS
40LIKES
Statistical Analysis of Exam Performance: Average Scores and Distribution Insights
DESCRIPTION
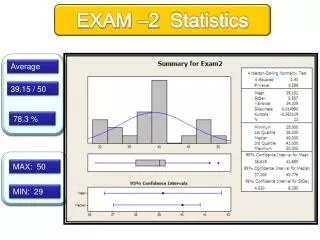
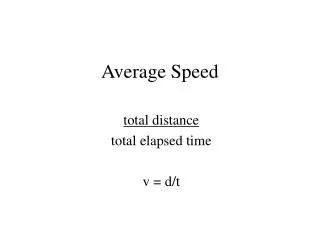
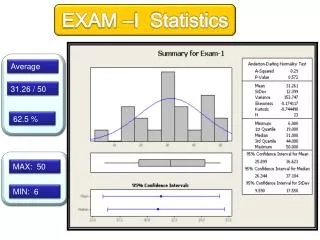
This analysis focuses on the performance statistics of two exams, specifically Exam 1 and Exam 2. Key metrics such as average scores (39.15 and 50.78) and percentage performance (3.%) are examined. The study also includes the maximum (50) and minimum (29) scores to provide a comprehensive overview of student performance. Additionally, a true and false analysis alongside a scatter plot is utilized to visualize the distribution and correlation between the exam scores. Insights derived can aid in understanding trends and addressing educational challenges.
Download
1 / 4
Download Presentation 
Statistical Analysis of Exam Performance: Average Scores and Distribution Insights
An Image/Link below is provided (as is) to download presentation
Download Policy: Content on the Website is provided to you AS IS for your information and personal use and may not be sold / licensed / shared on other websites without getting consent from its author.
Content is provided to you AS IS for your information and personal use only.
Download presentation by click this link.
While downloading, if for some reason you are not able to download a presentation, the publisher may have deleted the file from their server.
During download, if you can't get a presentation, the file might be deleted by the publisher.
E N D
Presentation Transcript
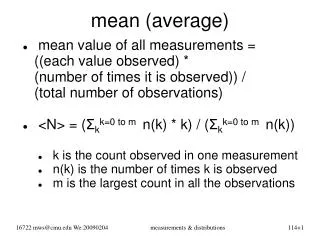
EXAM –2 Statistics Average 39.15 / 50 78.3 % MAX: 50 MIN: 29
Scatter Plot Exam-2 Exam-1


More Related