Download
1 / 8
80 likes | 203 Views
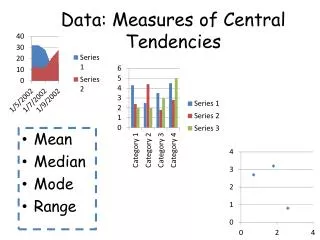
This notes guide provides a comprehensive overview of the measures of central tendency—mean, median, and mode. Learn how to calculate each measure effectively, focusing on the importance of avoiding outliers for accurate results. The mean is the average of a data set, calculated by adding all numbers and dividing by the count of items. The median is the middle value in a sorted list, while the mode is the most frequently occurring number. Follow specific examples to solidify your understanding and complete workbook exercises for practice.

E N D
Notes Measure of Central Tendency: describe the center of data. Mean: average add all #’s # of items BEST: NO OUTLIERS 3, 5, 2, 5, 2, 3, 1
Median Notes Median: middle number. • Must be least to greatest. • If two numbers, add and divide by 2 BEST: NO OUTLIERS; NO BIG GAPS IN MIDDLE OF NUMBERS 3, 8, 2, 3, 8, 3, 10 11, 21, 43, 1, 5, 9
Mode Notes Mode: most occurring numbers. BEST: MANY REPEATED NUMBERS 3, 4, 5, 3, 5, 6, 8, 3, 8
Find Mean 4, 5, 9, 3, 4, 8, 10, 3 10, 11, 4, 30, 45
Find Median 1, 5, 6, 8, 10, 7, 8, 9 5, 8, 9, 1, 2, 5, 7
Find Mode 12, 11, 10, 9, 8, 11, 15 1, 1, 8, 9, 8, 12, 5, 6, 7
Wrap Up Questions/Comments Hw: Workbook pg. 119