Download
1 / 18
190 likes | 215 Views
Understand the definitions, advantages, and disadvantages of mean, median, and mode in data analysis. Learn how to calculate central tendencies and interpret skewed distributions and grouped data. Practice constructing box-and-whisker plots.

E N D
Measures of Central Tendencies Week # 2
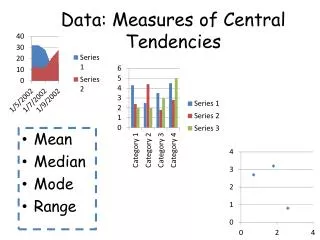
Definitions • Mean: or averageThe sum of a set of data divided by the number of data.(Do not round your answer unless directed to do so.) • Median: The middle value, or the mean of the middle two values, when the data is arranged in numerical order. • Mode: The value (number) that appears the most often.It is possible to have more than one mode (bimodal), and it is possible to have no mode. If there is no mode, write "no mode", do not write zero (0) • Range: the difference of the highest and lowest value • Midrange: sum of highest and lowest values, divided by two.
MEAN • Advantages: • Most popular measure in fields such as business, engineering and computer science. • It is unique - there is only one answer. • Useful when comparing sets of data. Disadvantages: • Affected by extreme values (outliers)
MEDIAN • Advantages: • Extreme values (outliers) do not affect the median as strongly as they do the mean. • Useful when comparing sets of data. • It is unique - there is only one answer.Disadvantages: • Not as popular as mean.
MODE • Advantages • Extreme values (outliers) do not affect the mode. • Can be used for non-numerical data; colors, ect. • Disadvantages • Not as popular as mean and median • Not necessarily unique - may be more than one answer • When no values repeat in the data set, the mode is every value and is useless. • When there is more than one mode, it is difficult to interpret and/or compare.
What happens if…. • If we replace the lowest grade with a zero:
What will happen to the measures of central tendency if we add the same amount to all data values, or multiply each data value by the same amount? Data Mean Mode Median Original Data Set: 6, 7, 8, 10, 12, 14, 14, 15, 16, 20 12.2 14 13 Add 3 to each data value 9, 10, 11, 13, 15, 17, 17, 18, 19, 23 15.2 17 16 Multiply 2 times each data value 12, 14, 16, 20, 24, 28, 28, 30, 32, 40 24.4 28 26
Distribution of data: • Skewed left, negatively skewed median>mean b) Skewed right, positively skewed mean>median c) Symmetric, mean=median=mode
Example #1Find the mean, median, mode, range, and midrange for the following data: 5, 15, 10, 15, 5, 10, 10, 20, 25, 15.(You will need to organize the data.)5, 5, 10, 10, 10, 15, 15, 15, 20, 25 Mean: Median: 5, 5, 10, 10, 10, 15, 15, 15, 20, 25 Listing the data in order is the easiest way to find the median. The numbers 10 and 15 both fall in the middle. Average these two numbers to get the median: (10+15)/2 = 12.5 Mode: Two numbers appear most often:10 and 15. There are three 10's and three 15's. In this example there are two answers for the mode. Range: The difference of highest & lowest; 25 – 5 =20 Midrange: Average of highest & lowest; (5+25)/2 = 15
EX. 2 - On his first 5 biology tests, Bob received the following scores: 72, 86, 92, 63,and77. What test score must Bob earn on his sixth test so that his average (mean score) for all six tests will be exactly 80? Show how you arrived at your answer. Possible solution method: Set up an equation to represent the situation. Remember to use all 6 test scores: 72 + 86 + 92 + 63 + 77 + x = 80 6
EX. 3 – Grouped Data: On a statistics examination, 7 students received scores of 95, 9 students received 90, 6 students received 85, 4 students received 80, there was one 75, 3 students with a 70, and one student received 65. The mean score on this examination was: (nearest 10th)
EX. 4 – Grouped Data: Using this frequency table of test scores Find the Mean, Median, Mode, Range, and Midrange
Box and Whisker Plots • Determine the five key values • (5 number summary) • Minimum value • Maximum value • Median (2nd Quartile) or Q2 • 1st Quartile – median of values less than Q2 • 3rd Quartile - median of values greater than Q2 - Interquartile range = Q3-Q1
Ex. Construct a box-and-whisker plot for the following data:The data: Math test scores 80, 75, 90, 95, 65, 65, 80, 85, 70, 100 1) Write the data in numerical order. Find the five key values. median (2nd quartile) = 80first quartile = 70third quartile = 90minimum = 65maximum = 100 2) Create a number line and plot values below it 3) Draw a box with ends through the points for the first and third quartiles. Then draw a vertical line through the box at the median point. Now, draw the whiskers (or lines) from each end of the box to these minimum and maximum values.
* Outlier – one value that is an extreme value: You may see a box-and-whisker plot, like the one below, which contains an asterisk. * 10 is an extreme value and is placed on the graph but not part of the box or whisker
25% of data 25% of data 25% of data 25% of data