Download
1 / 11
141 likes | 679 Views
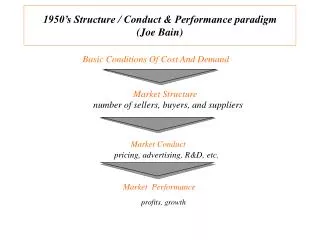
1950’s Structure / Conduct & Performance paradigm (Joe Bain). Basic Conditions Of Cost And Demand. Market Structure. number of sellers, buyers, and suppliers. Market Conduct. pricing, advertising, R&D, etc. Market Performance. profits, growth. Strategic Group Analysis.

E N D
1950’s Structure / Conduct & Performance paradigm (Joe Bain) Basic Conditions Of Cost And Demand Market Structure number of sellers, buyers, and suppliers Market Conduct pricing, advertising, R&D, etc. Market Performance profits, growth
Strategic Group Analysis “No two species that depend on the same prey will think differently” - Gause “Laws of natural competition” A strategic group is a group of firms in an industry following the same or similar strategy. • Identifying strategic groups: • Identify principal strategic variables which distinguish firms. • Position each firm in relation to these variables. • Identify clusters of common competing characteristic
Strategic Groups in the World Automobile Industry Broad GLOBAL, BROAD-LINE PRODUCERS e.g., GM, Ford, Toyota, Nissan, Honda, VW REGIONALLY FOCUSED BROAD-LINE PRODUCERS e.g. Fiat, PSA, Renault, Rover, Chrysler GLOBAL SUPPLIERS OF NARROW MODEL RANGE e.g., Volvo, Subaru, Isuzu, Suzuki, Saab, Hyundai NATIONALLY FOCUSED, INTERMEDIATE LINE PRODUCERS e.g. Tofas, Kia, VAZ, Maruti Product Range LUXURY CAR MANUFACTURERS e.g., Jaguar, Rolls Royce, Daimler-Benz, BMW NATIONALLY- FOCUSED, SMALL, SPECIALIST PRODUCERS e.g., Bristol (U.K.), Classic Roadsters (U.S.), Morgan (U.K.) PERFORMANCE CAR PRODUCERS e.g., Porsche, Maserati, Lotus Narrow National Geographical Scope Global
A Framework for Competitor Analysis OBJECTIVES • What are competitors current goals? • Is performance meeting there goals? • How are its goals likely to change? STRATEGY • How is the firm competing? ASSUMPTIONS • What assumptions does the competitor hold about the industry and itself? RESOURCES & CAPABILITIES • What are the competitors’ key strengths and weaknesses? • PREDICTIONS • What strategy changes • will the competitor • initiate? • How will the competitor • respond to our strategic • initiatives?
Tool: CCSI (Core Competency Strategic Intent matrix Matrix) • The CCSI matrix makes firm dynamics alive. • Matrices are made at regular intervals • Yearly or quarterly depending on how fast things are changing • The two dimensions of the matrix are: • Core Competency: firms’ relative capacity -- as measured by Tobin’s Q or market/book value or defect rates(Customer switching) or as rated by industry experts. • Strategic Intent: firms’ relative aggressiveness -- as measured by R&D expenditures or capital investments or analysis of press releases.
High Core Capabilities Average Low Passive Average Aggressive Strategic Intent Tool: CCSI Matrix Each competitor is mapped as a circle: • the size of which reflects sales or capitalization or assets • and the pie slice in which reflects free cash or other available resources
Case: CCSI Analysis of the early 90s Automobile Industry • Flip & Observe ; • The decline of Honda & Toyota • The ascendancy of Ford • General Motors unsuccessful run at leadership • Chrysler’s repositioning as an up and coming star.
High Low .88 .92 .96 1.04 1.08 1.12 Automobile Industry 1990 illustrative Toyota 1.5 Honda 1.0 .5 General Motors Core Capabilities Chrysler Ford (.50) (1.0) (1.5) Passive Aggressive Strategic Intent
Toyota High 1.5 Honda 1.0 .5 (.50) (1.0) (1.5) Low .88 .92 .96 1.04 1.08 1.12 Passive Aggressive Automobile Industry 1991 illustrative Core Capabilities Chrysler General Motors Ford Strategic Intent
High Toyota 1.5 Honda 1.0 .5 Ford General Motors Chrysler (.50) (1.0) (1.5) Low .88 .92 .96 1.04 1.08 1.12 Passive Aggressive Automobile Industry 1992 illustrative Core Capabilities Strategic Intent