Download

1 / 12
130 likes | 345 Views
Figure 3.1. How a dead bivalve becomes a fossil. The sequence of stages between the death of the organism and its preservation in various ways. Figure 3.2.

E N D
Figure 3.1 How a dead bivalve becomes a fossil. The sequence of stages between the death of the organism and its preservation in various ways.
Figure 3.2 The relative rates of decay and mineralization determine the kinds of tissues that may be preserved. At minimum decay rate and with very early mineralization, highly labile muscle tissues may be preserved. When decay has gone to a maximum, and when mineralization occurs late, all that is left are the non-organic tissues such as shells. (Based on Allison 1988.)
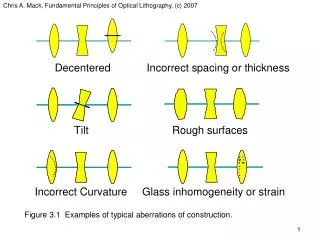
Figure 3.3 The conditions for exceptional preservation. (a) The rate of burial and organic content are key controls on the nature of mineralization of organic matter in fossils. Pyritization (high rate of burial, low organic content) may preserve entirely soft-bodied worms, as in an example from the Early Devonian Hunsrückschiefer of Germany (b). Phosphatization (low rate of burial, high organic content) may preserve trilobite limbs such as this example of Agnostides from the Cambrian of Sweden (c). Soft parts may be preserved in carbonate (high rate of burial, high organic content), such as polyps in a colonial coral, Favosites, from the Early Silurian of Canada (d). If decay never starts, small animals may be preserved organically and without loss of material, such as a fly in amber from the Early Tertiary of the Baltic region (e). (a, based on Allison 1988; b, courtesy of Phil Wilby; c–e, courtesy of Derek Briggs.)
Figure 3.4 Exceptional preservation of muscle in the Jurassic horseshoe crab Mesolimulus walchi: (a) the whole specimen showing the rounded headshield (prosoma), with preserved muscle tissues in the middle; (b) muscle fibers; (c) banding across muscle fibers revealed by early decay; and (d) small coccoid microbes associated with the muscle fibers. Scale bars: 20 mm (a), 50 µm (b), 10 µm (c, d). (Courtesy of Derek Briggs.)
Figure 3.5 An imaginary cross-section showing possible sites of exceptional fossil preservation, most of which are conservation deposits, but a few of which are concentration deposits. (Based on Seilacher et al. 1985.)
Figure 3.6 Processes of breakage and diagenesis of fossils. Dead organisms may be disarticulated (a) or fragmented (b) by scavenging or transport, abraded (c) by physical movement, bioeroded (d) by borers, or corroded and dissolved (e) by solution in the sediment. After burial, specimens may be flattened (f) by the weight of sediment above, or various forms of chemical diagenesis, such as the replacement of aragonite by calcite (g) may take place.
Figure 3.7 (a) Numerous examples of deformation of the brachiopod Eoplectodonta: in a tectonized mudstone from the Silurian of Ireland. (b) A single deformed example (c. 20 mm wide) of a Cambrian Billingsella fossil from the Himalayas (Bhutan) and (c) the same example retrodeformed to its original shape.
Figure 3.8 Different modes of plant preservation. (a) Permineralization, a silicified plant stem from the Rhynie Chert (Early Devonian, Scotland) ( 50). (b) Coalified compression, leaves of Annularia from the Late Carboniferous, Wales ( 0.7). (c) Authigenic preservation, a mold of Lepidostrobus from the Late Carboniferous, Wales ( 0.5). (d) Direct preservation of a microscopic fossilized diatom in the original silica (scale bar, 20 µm). (a, courtesy of Dianne Edwards; b, c, courtesy of Chris Cleal; d, courtesy of David Ryves.)
Figure 3.9 Mean scores of the stratigraphic consistency index (SCI), the relative completeness index (RCI) and the gap excess ratio (GER) for five geological time partitions of the data set of 1000 cladograms. Note that the SCI and GER indicate no change through time, while the RCI becomes worse (lower values) from the Paleozoic to Cenozoic – but the RCI depends on total geological time, and so is not a good measure for this study. Pz, cladograms with origins solely in the Paleozoic; Pz/Mz, cladograms with origins spanning the Paleozoic and Mesozoic; Mz, cladograms with origins solely in the Mesozoic; Mz/Cz, cladograms with origins spanning the Mesozoic and Cenozoic; Cz, cladograms with origins solely in the Cenozoic. (Based on Benton et al. 2000.)
Figure 3.10 Clade–stratigraphic metrics. Calculation of the three congruence metrics for age versus clade comparisons. SCI is the ratio of consistent to inconsistent nodes in a cladogram. RCI is RCI = 1(MIG/SRL), where MIG is minimum implied gap, or ghost range, and SRL is standard range length, the known fossil record. GER is GER = 1(MIG – Gmin)/(Gmax – Gmin), where Gmin is the minimum possible sum of ghost ranges and Gmax the maximum, for any given distribution of origination dates. (a) The observed tree with SCI calculated according to the distribution of ranges in (b). (b) The observed tree and observed distribution of stratigraphic range data, yielding an RCI of 66.0%. GER is derived from Gmin and Gmax values calculated in (c) and (d). (c) The stratigraphic ranges from (b) rearranged on a pectinate tree to yield the smallest possible MIG or Gmin. (d) The stratigraphic ranges from (b) rearranged on a pectinate tree to yield the largest possible MIG or Gmax. (Based on Benton et al. 2000.)
Figure 3.11 Is the fossil record controlled by the rock record? (a) Plot of number of marine geological formations and extinction rate against the last 500 myr of geological time. Note how closely the rock and fossil curves follow each other. (b) Plot of diversification curves for marine families of animals from analyses by Sepkoski (i) and Benton (ii), compared with (iii) the sea-level curve for the Phanerozoic (fine line) and the percentage of platform flooding (heavy line). Note the approximate matching of diversity and sea-level curves until the past 100 myr. (a, based on Peters & Foote 2002; b, based on Smith 2001.)
Figure 3.12 Paleontological knowledge has improved by about 5% in the 26-year period between 1967 and 1993. According to 1993 data there is 5% less gap, as assessed by a relative completeness index (RCI), implied in the fossil record of tetrapods than in 1967. This figure was obtained by comparing the order of branching points in cladograms with the order of appearance of fossils in the rocks. Will there be a further 5% shift to the right (i.e. towards 100% completeness) by the year 2019? (Based on Benton & Storrs 1994.)