Download
1 / 42
420 likes | 619 Views
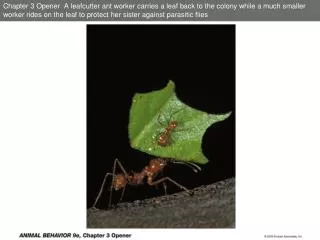
Chapter 3 Opener A leafcutter ant worker carries a leaf back to the colony while a much smaller worker rides on the leaf to protect her sister against parasitic flies. Figure 3.1 Development of worker behavior in honey bees.

E N D
Chapter 3 Opener A leafcutter ant worker carries a leaf back to the colony while a much smaller worker rides on the leaf to protect her sister against parasitic flies
Figure 3.2 Gene activity varies in the brains of nurse bees and foragers
Figure 3.3 Social environment and task specialization by worker honey bees
Figure 3.6 Cross-fostering has different imprinting effects in two related songbirds
Figure 3.8 A Clark’s nutcracker holding a seed in its bill that the bird is about to cache underground
Figure 3.12 Kin discrimination in Belding’s ground squirrels
Figure 3.13 The ability of Belding’s ground squirrels to learn their own odor
Figure 3.15 Funnel cage for recording the migratory orientation of captive birds
Figure 3.16 Response to artificial selection on the fall migration departure date of blackcaps
Figure 3.19 A coastal Californian garter snake about to consume a banana slug
Figure 3.20 Response of newborn, naïve garter snakes to slug cubes
Figure 3.24 Genetic differences cause behavioral differences in fruit fly larvae (Part 1)
Figure 3.24 Genetic differences cause behavioral differences in fruit fly larvae (Part 2)
Figure 3.25 Surrogate mothers used in social deprivation experiments
Figure 3.28 Mating males of the damselfly Lestes viridis (red bars) have more symmetrical wings than unmated males (orange bars)
Brown et al. 2005 a, Mean dance ability of males (filled bars throughout) and females (open bars throughout) by level of bodily symmetry. Error bars represent 95% confidence intervals. P values for within-sex are shown. b, Mean strength of symmetry preference (that is, evaluations of asymmetrical dancers subtracted from evaluations of symmetrical dancers) by sex of dancer and sex of evaluator. Error bars represent 95% confidence intervals. P value at top of panel indicates significantly greater female than male evaluator preference for symmetrical male dancers.
Figure 3.31 Developmental switch mechanisms can produce polyphenisms within the same species
Figure 3.36 Male thynnine wasps can be deceived into “mating” with a flower
Peakall 1990 http://www.anu.edu.au/BoZo/orchid_pollination/
Peakall 1990 Males learn to avoid orchid over time (quicker decline in visits than for visits to females)
Peakall 1990 Male wasps revisit flowers when position is moved
Figure 3.38 Spatial learning abilities differ among members of the crow family
Figure 3.40 Sex differences in spatial learning ability are linked to home range size
Kroodsma and Canady 1985 http://www.bwps.org/images/Competitions/Digital/2005-2006/May06/AA_MarshWrenHanging_IDicker.jpg
Figure 3.45 Vampire bats cannot form learned taste aversions