Download
1 / 21
220 likes | 384 Views
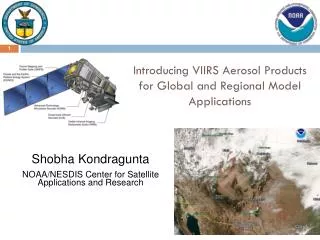
A Tutorial on MODIS and VIIRS Aerosol Products from Direct Broadcast Data on IDEA. Hai Zhang 1 , Shobha Kondragunta 2 , Hongqing Liu 1 IMSG at NOAA NOAA NESDIS 11/22/2013 VIIRS Aerosol Science and Operational Users Workshop.

E N D
A Tutorial on MODIS and VIIRS Aerosol Products from Direct Broadcast Data on IDEA Hai Zhang1, Shobha Kondragunta2, Hongqing Liu1 IMSG at NOAA NOAA NESDIS 11/22/2013 VIIRS Aerosol Science and Operational Users Workshop
IDEA: Infusing satellite Data into Environmental Applications • Provide near-real-time satellite aerosol information and analysis over the United States to the operational air quality community • Satellite data • MODIS Terra, Aqua, VIIRS, GASP East, GASP West • AOD (aerosol optical depth) or AOT (aerosol optical thickness) • RGB images (MODIS, VIIRS) • Other data for analysis • Meteorological data: wind, precipitation • In-situ PM2.5 • OMI Aerosol Index (AI) • WF_ABBA (Wild Fire Automated Biomass Burning Algorithm), fire hotspots • Developed by NASA for MODIS and transitioned to NOAA. NOAA enhanced IDEA to include GOES-E, GOES-W, OMI, VIIRS and surface PM2.5 estimation
IDEA Data flow diagram GOES East and West MODIS Terra and Aqua VIIRS VIIRS L1B, cloud mask data MODIS data processing L1B, aerosol products GOES data processing GASP Aerosol product Generate VIIRS aerosol product locally (STAR research version) EPA AIRNow PM2.5 Data processing, forward trajectories, composite plots, etc NOAA Meteorological data IDEA Website Local computer at NOAA NOAA WF_ABBA http://www.star.nesdis.noaa.gov/smcd/spb/aq/
IDEA web page http://www.star.nesdis.noaa.gov/smcd/spb/aq/ Click tabs to select satellite Click panels to select product
Products on IDEA • Satellite RGB and AOD images • 48-hour forward trajectories • 3-day composite history of AOD, wind, in-situ PM2.5, and fire hotspots • Daily PM2.5 estimates from MODIS AOD • AOD-PM2.5 correlation, Estimated PM2.5 vs in-situ PM2.5 correlationand RMSE maps • Time series, scatter plots, histogram, etc for AOD, estimated and in-situ PM2.5 at PM2.5 stations
RGB and AOD images select date select satellite Change AOD opacity Click on individual regions to see regional AOD images Download images or google earth kml file
48-hour forward trajectory animation • AOD (red-blue) • 850 mb winds (white arrows) • Precipitation (yellow) • Trajectories from high AOD regions (pink-white): • Dark pink – close to the surface • White – high above surface • Verification plot is linked to the AOD plot two days later
48-hour forward trajectory animation • AOD (red-blue) • 850 mb winds (white arrows) • Precipitation (yellow) • Trajectories from high AOD regions (pink-white): • Dark pink – close to the surface • White – high above surface • Verification plot is linked to the AOD plot two days later
3-day composite history animation • AOD (blue-red) • 850 mb wind (white arrows) • In-situ PM2.5 (green-yellow-orange-red filled circles) • Fire hotspots (pink dots)
Daily PM2.5 estimations from MODIS AOD • Derived from Aaron van Donkelaar’s algorithm • (Donkelaar et al. Environ. Sci. Tech. 2012) • Overlaid by in-situ PM2.5
Correlation map between PM2.5 and AOD (MODIS, GASP) over CONUS Correlation, RMSE between estimated PM2.5 from MODIS AOD and in-situ PM2.5
Time series, scatter plots, histograms at each PM2.5 station • MODIS, GASP AOD vs PM2.5 • Time series • Scatter plots • Histogram • Estimated daily PM2.5 vs in-situ PM2.5 • Time series • Scatter plots
VIIRS images over Alaska VIIRS OCONUS • Multiple images per day • Animation controls • Opacity sliders • AOD quality selections • Fire hotspots • County boundaries
Differences in AOD retrieval between MODIS and VIIRS • MODIS and VIIRS aerosol retrieval algorithms are different • Different bands are used • Retrieval algorithms are different • Cloud masks are different • Other internal screening tests are different over land: soil dominate, ephemeral water, etc • Spatial resolution • MODIS 10 km • VIIRS EDR 6 km, IP 750 m. We use high quality EDR AOD on IDEA unless specified • AOD retrieval range • MODIS [-0.05,5.0] • VIIRS [0,2.0] (will be extended to [-0.05,5.0] soon) • Therefore, MODIS and VIIRS AOD can have different values and data coverage
Some examples of case studies on data coverage Example 1: smoke in central US 8/17/2013 VIIRS RGB 20130817 Aqua RGB 20130817 Aqua RGB & AOD 20130817 VIIRS RGB & EDR High Quality AOD 20130817 No AOT because it is soil dominated area
Example 2: 6/20/2013 Kansas smoke MODIS Aqua RGB VIIRS RGB No AOT because the area is set as cirrus cloud by VIIRS cloud mask product MODIS Aqua RGB & AOT VIIRS RGB & EDR AOT (high quality)
Example 3: 8/23/2013 California fire Aqua RGB & AOD VIIRS RGB & EDR AOD high quality Neither has retrieval over heavy smoke region VIIRS retrieval identifies this area as ephemeral water
Display missing retrieval areas of VIIRS AOD • Use IP AOD, since pixels mask information are not in EDR AOD data • In addition to high quality IP AOD, also show AOD at pixels marked as • Soil dominated • Cirrus cloud
EDR AOD high quality IP AOD for display 8/17/2013 smoke in central US (soil dominated) 6/20/2013 Kansas smoke (cirrus cloud)
Summary • Near-real-time MODIS, VIIRS aerosol and RGB images and analysis are available on IDEA • Comparing to AERONET AOD, VIIRS AOD has similar accuracy as MODIS AOD over CONUS • The data coverage may be different between MODIS and VIIRS due to the difference in screening algorithm • Modified IP AOD display to show missing retrievals in high quality EDR AOD
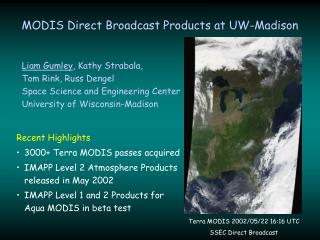
Acknowledgements • Liam Gumley and Kathy Strabala (University of Wisconsin Madison) • Direct broadcast VIIRS data over CONUS • Scott Macfarlane (Univ. of Alaska) • Direct broadcast VIIRS data over Alaska