Download
1 / 10
100 likes | 212 Views
Air Monitoring Stations and Proximity to Major Roads. Caitlin Morrison UP206A February 12, 2012. Background. Particle exposure pollution (>2.5 microns in diameter) can cause health issues with the heart and lung.

E N D
Air Monitoring Stations and Proximity to Major Roads Caitlin Morrison UP206A February 12, 2012
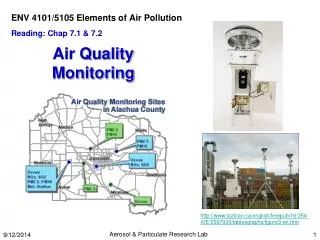
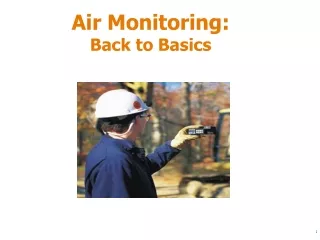
Background • Particle exposure pollution (>2.5 microns in diameter) can cause health issues with the heart and lung. • Sources of fine particles (PM 2.5) include all types of combustion activities: • Motor vehicles • Power plants • Wood burning
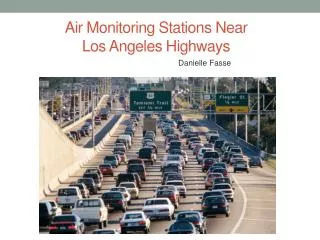
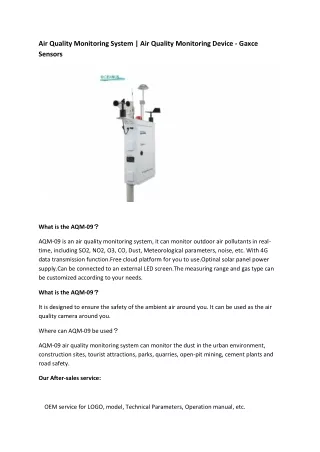
PM 2.5 Air Monitoring Stations in California • California Air Resources Board measures pollutants at over 50 sites • PM 2.5 mass concentrations are collected at National Air Monitoring Stations (NAMS) and State and Local Air Monitoring Sites (SLAMS)
PM 2.5 Averages Throughout California • Maximum: 21.2 µg/m3 (Kern) • Minimum: 3.3 µg/m3 (Lakeport) • California Average: 10.95 µg/m3 • LA County Average: 13.2 µg/m3 (across 6 sites)
☐
Roadways Near Compton Monitoring Station - 1, 3 and 5 Mile Buffers ☐
Additional Information SKILLS USED • Inset map • Graduated Symbols – Graduated symbols represent AVERAGE PM 2.5 therefore they were given a subtle grey outline to represent interpretation of averages • Boundary sub-sets selection (Kern and LA county was derived from selecting counties in the view of California and was converted to a shapefile) • Buffering – Slide 6 and Slide 7 show major roadways that exist within the one mile buffer (the one mile buffer was not shown on these maps in an attempt to keep the presentation simple) • Geoprocessing (Clip California and US States Layer with caliDetail) • Geocoding (Air Monitoring Stations added using X Y coordinates) REFERENCES • California Enviornmental Protection Agency – Air Resources Board - http://www.arb.ca.gov/research/aaqs/aaqs.htm • Census Tiger / Line Data (2009) - http://www.census.gov/geo/www/tiger/tgrshp2009/tgrshp2009.html • National Atlas Mapping Professionals - http://www.nationalatlas.gov/pros.html • Benton Clean Air Agency (Image of size comparison; slide 2) http://bentoncleanair.org/air-quality/air-pollutants-frequent-questions • Butte County Air Quality Management District (image; title slide) - http://www.bcaqmd.org/page/monitoring-air-quality.php • Image of LA downtown (slide 2 & slide 10) – Caitlin Morrison • Image of Compton MLK Monument - http://en.wikipedia.org/wiki File:Compton_martin_luther_king_monument.jpg • Image of Bakersfield - http://en.wikipedia.org/wiki/File:Bakersfield_CA_-_sign.jpg