Download
1 / 32
320 likes | 473 Views
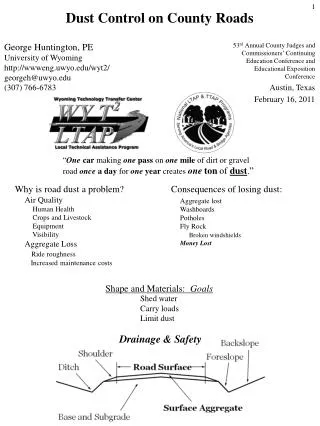
Wyoming County Paved Roads Management and Monitoring. Khaled Ksaibati, Ph.D., P.E. STIC June, 2014. Why monitor paved county roads?. Wyoming counties face significant risk if heavy truck traffic increases on many paved county roads. What if they fall apart?.

E N D
Wyoming County Paved Roads Management and Monitoring Khaled Ksaibati, Ph.D., P.E. STIC June, 2014
Why monitor paved county roads? • Wyoming counties face significant risk if heavy truck traffic increases on many paved county roads.
What if they fall apart? • No inexpensive options. You can’t blade this.
Why are we in this situation? • Many roads were paved in the 1950’s, ‘60’s and ‘70’s. • Designed for lighter loads, if they were designed at all. • Asphalt was better, aggregate was cheaper. • The asphalt has aged. It is brittle. It cracks easily if heavy loads are applied, specially if the base is soft due to water. Water enters through cracks, softening the base so potholes form and the road falls apart.
Why do paved roads present a much greater risk than unpaved roads? • Typically 20% or less of a county’s road mileage. • Unpaved roads can be restored with new gravel for about $50,000 per mile. • Paved road restoration costs far more. Even returning to a gravel road could be several hundred thousand dollars per mile. • The annual cost of additional truck traffic on unpaved roads will rarely be over $30,000 per mile, but the one-time cost to restore a destroyed paved road could easily be over $500,000 per mile.
Part of the Problem 11½’ 11½’ Overlaid Pavement Structure C L 12’ 12’ Original Pavement Structure
Narrow tops are… • More dangerous. • More prone to edge breakup.
Objectives • Document current conditions. • Enable counties to determine impacts of industrial or other activities using paved county roads. • Compare to state highways • Project future conditions. • Establish maintenance, repair, rehabilitation and reconstruction strategies.
Pavement Monitoring Benefits • Current conditions identified, allowing appropriate decision to be made. • Impacts from oil and gas drilling and other industries assessed and evaluated. • Other counties’ treatment methods can be quantitatively evaluated and implemented. • WYDOT pavement management system data and decision processes can be applied to county road networks.
Pavement Monitoring Benefits • Appropriate treatment strategies developed for individual roads at various traffic levels. • Future maintenance and rehabilitation needs projected. • No need for counties with limited resources to develop their own monitoring or analysis methods. • Provide the state legislature with defensible data justifying funding for paved county roads.
Converse County PSI PSI > 3.5: Excellent 3.5 > PSI > 3.0: Good 3.0 > PSI > 2.5: Fair 2.5 > PSI: Poor
Proposed Monitoring Options • Pavement Thicknesses • Ground Penetrating Radar (GPR) • Pathway Services® van • Hired annually by WYDOT • Direct measurements • Roughness • Rutting • Video logs • May be evaluated in the office to generate a pavement condition index (PCI). • Provide a log of pavement surface and roadside conditions.
Data Compilation and Analytical Options • None • Pavement Condition/Cracking Index (PCI) • Data Summary • Data Analysis
Pavement Condition Index • From Pathway video logs • Numerical index from 0 to 100 quantifying the condition of a roadway based on surface distresses. • Extracted from 1000’ sample sites per mile of paved roadway. • Manually measured and interpreted through road surface videos collected by Pathway van at highway speeds.
Ground Penetrating Radar (GPR) • Assessment of asphalt and base thicknesses. • Essential for design and for durability analyses. • Conducted by a specialized van at highway speeds.
Inventory and Segmentation Pathway Services® Van GPR Provider (TBD) Roughness Asphalt Surface Thicknesses Rutting Base Thicknesses Video Logs Storage on Website Pavement Condition Index (PCI) Data Analysis and Reports Remaining Service Lives Data Summaries Treatment Recommendations Tables Maps Comparisons to State Highways
Inventory and Segmentation Pathway Services® Van GPR Provider (TBD) Roughness Asphalt Surface Thicknesses Rutting Base Thicknesses Video Logs Storage on Website Pavement Condition Index (PCI) Data Analysis and Reports Remaining Service Lives Data Summaries Treatment Recommendations Tables Maps Comparisons to State Highways
WACERS’ Recommendation • Collect all data. • Ground Penetrating Radar (GPR) • Roughness • Rutting • Video logs • Pavement Condition Index (PCI) • Data Collection Frequency • Every 2 years • No analysis. • Many analytical options remain open once the data is collected and stored.
Data Collection Frequency • First Year: Monitor all paved county roads. • Subsequent Years: Monitor half the state each year. W – 1,270 miles; E – 1,241 miles SW – 1,278 miles; NE – 1,233 miles
Work to be Performed • Wyoming T2/LTAP • Inventory and Segmentation • Pavement Condition Index (PCI) processing • Host website containing raw data • Pathway Services® • Roughness • Rutting • Video Logs • Commercial GPR Tester (TBD) • Asphalt and Base Thicknesses
Cost Allocation • WYDOT will cover $215,584 in the first year. • $100,000 is requested from the STIC in the first year. • Counties have agreed to cover the running cost for subsequent years.
Funding • 39‑17‑111. Distribution.
Wyoming County Paved Roads Management and Monitoring Questions? Comments? Khaled Ksaibati, Ph.D., P.E. STIC June, 2014