Download
1 / 2
20 likes | 173 Views
SRI 2007: CLS Optical Metrology Facility- Overview. Brian Yates 1 , Dylan Maxwell 1 1 Canadian Light Source Inc., 101 Perimeter Road, Saskatoon, SK S7N 0X4, Canada. Canadian Light Source Metrology Facility Overview:

E N D
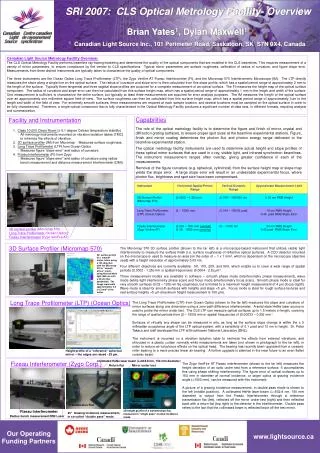
SRI 2007: CLS Optical Metrology Facility- Overview Brian Yates1, Dylan Maxwell1 1 Canadian Light Source Inc., 101 Perimeter Road, Saskatoon, SK S7N 0X4, Canada Canadian Light Source Metrology Facility Overview: The CLS Optical Metrology Facility performs beamline ray-tracing/modeling and determines the quality of the optical components that are installed in the CLS beamlines. This requires measurement of a variety of mirror parameters, to ensure compliance by the vendor to CLS specifications. Typical mirror parameters are surface roughness, calibration of radius of curvature, and figure slope error. Measurements from three distinct instruments are typically taken to characterize the quality of optical components. The three instruments are the Ocean Optics Long Trace Profilometer (LTP), the Zygo Verifire AT Fizeau Interferometer (FI), and the Micromap 570 Interferometric Microscope (IM). The LTP directly measures the slope along a single line on the optical surface. The radius of curvature and slope error is then calculated from this slope profile, which has a spatial period range of approximately 2 mm to the length of the surface. Typically three tangential and three sagittal slope profiles are acquired for a complete measurement of an optical surface. The FI measures the height map of the optical surface component. The radius of curvature and slope error can then be calculated from this surface height map, which has a spatial period range of approximately 1 mm to the length and width of the surface. One measurement is sufficient to characterize the entire surface, but typically at least three measurements are acquired for error analysis purposes. The IM measures the height of the optical surface over an approximately one millimetre square field‑of‑view. The surface roughness can then be calculated from this surface height map, which has a spatial period range of approximately 1µm to the length and width of the field of view. For extremely smooth surfaces, three measurements are required at each sample location, and several locations must be sampled on the optical surface in order to be fully characterized. Therefore, a single optical component that is fully characterized in the Optical Metrology Facility produces a significant number of data sets, in different formats, requiring analysis and summarization. Facility and Instrumentation Capabilities 1. Class 10,000 Clean Room (± 0.1 degree Celsius temperature stability) - All metrology instruments mounted on vibration isolation tables (TMC) to minimize the effects of vibration. 2. 3D surface profiler (IM) from Micromap - Measures surface roughness. 3. Long Trace Profilometer (LTP) from Ocean Optics - Measures figure “slope error” and radius of curvature. 4. Fizeau Interferometer (FI) from Zygo - Measures figure “slope error” and radius of curvature using radius bench measurement and distance measurement interferometer (DMI). The role of the optical metrology facility is to determine the figure and finish of mirror, crystal and diffraction grating surfaces, to ensure proper spot sizes at the beamline experimental stations. Figure, finish and mirror coating determines the photon flux and photon energy range delivered to the beamline experimental station. The optical metrology facility instruments are used to determine actual height and slope profiles of these optical mirror surfaces that are used in x-ray, visible light, and infrared synchrotron beamlines. The instrument measurement ranges often overlap, giving greater confidence in each of the measurements. Removal of the figure curvature (e.g. spherical, cylindrical) from the surface height map or slope map yields the slope error. A large slope error will result in an undesirable experimental focus, where photon flux, brightness and spot size have been compromised. 3D surface profiler (Micromap 570) Long Trace Profilometer (Ocean Optics) Fizeau Interferometer (Zygo VeriFire AT) 3D Surface Profiler (Micromap 570) The Micromap 570 3D surface profiler (shown to the far left) is a microscope-based instrument that utilizes visible light interferometry to measure the surface finish (i.e. surface roughness) of reflective optical surfaces. A CCD detector mounted on the microscope is used to measure an area (on the order of ~ 1 x 1 mm2, which is dependent on the microscope objective used) with a height resolution of approximately 0.03 nm. Four different objectives are currently available: 5X, 10X, 20X, and 50X, which enable us to cover a wide range of spatial periods (0.0002 - 1.25) mm or spatial frequencies (0.0004 - 2.5) µm-1. Three measurement modes are available in software – smooth phase mode (interferometry phase measurement), wave mode (white light interferometry phase scan) and focus mode (interferometry focus scan). Smooth phase mode is ideal for very smooth surfaces (0.02 – 100) nm Sq roughness, but is limited to a maximum height measurement of 4 µm (focus depth). Wave mode is ideal for smooth surfaces with heights and steps <5 µm. Focus mode is ideal for rough surface textures and real surface heights >5 mm (maximum height measurement is 150 µm). 3D surface profile of a smooth mirror, taken using a 10X objective with the Micromap 570 in “smooth phase” mode, using filtered white light (550 nm with a 25 nm filter bandwidth). The image represents approximately 0.5 x 0.5 mm2 of the mirror. Long Trace Profilometer (LTP) (Ocean Optics) The Long Trace Profilometer (LTP) from Ocean Optics (shown to the far left) measures the slope and curvature of mirror surfaces along one dimension using a zero-path difference interferometer. A solid state HeNe laser source is used to probe the mirror under test. The CLS LTP can measure optical surfaces up to 1.5 meters in length, covering the range of spatial periods from (2 – 1500) mm or spatial frequencies of (0.00033 – 0.25) mm-1. Surfaces of virtually any shape can be measured in situ, as long as the surface slope change is within the ± 5 milliradian acceptance angle of the LTP optical system, with a sensitivity of 0.1 µrad and 10 nm in height. Dr. Peter Takacs and staff developed the LTP at Brookhaven National Laboratory (BNL). The instrument is mounted on a vibration isolation table to minimize the effects from external vibrations, and shrouded in a plastic curtain normally while measurements are taken (not shown in photograph to the far left), in order to reduce air turbulence effects on the optical head. The bearing has recently been upgraded from a crossed-roller bearing to a more precise linear air bearing. A further upgrade is planned in the near future to an even flatter ceramic beam. Height profile of a “reference” spherical mirror – the edges are raised ~20 µm. collimated HeNe laser beam (l=632.8 nm, 150 mm diameter) Fizeau Interferometer (Zygo Corp.) The Zygo VeriFire AT Fizeau interferometer (shown to the far left) measures the height deviation of an optic under test from a reference surface. It accomplishes this using phase shifting interferometry. The figure error of optical surfaces up to 150 mm in diameter at normal incidence, or larger optics at grazing incidence angle (<1500 mm), can be measured with this instrument. A picture of a grazing incidence measurement, in double pass mode is shown to the left (middle position). A collimated HeNe laser beam (l=632.8 nm, 150 mm diameter) is output from the Fizeau Interferometer through a reference transmission flat (left), reflected off the mirror under test (right) and then reflected back with a return flat (top right) to the detector in the interferometer. Double pass refers to the fact that the collimated beam is reflected twice off the test mirror. Return flat Mirror under test Transmission Flat Fizeau Interferometer 3D height profile of a transmission flat, measured in “single pass” normal incidence mode. 45° Grazing incidence measurement, in so-called “double pass” mode. Radius bench measurement/DMI Laser
SRI 2007: CLS Optical Metrology Facility- Optical Tip/Tilt Stage, Software Development • Brian Yates1, Dylan Maxwell1, Siyue Chen1, Bruce Truax2 • Canadian Light Source Inc., 101 Perimeter Road, Saskatoon, SK S7N 0X4, Canada • Diffraction Limited Design LLC, 388 Wedgewood Road, Southington, CT 06489, U.S.A. Canadian Light Source Metrology Facility – Software Development: These metrology instruments are each provided with their own control and analysis software. In general this software provides adequate functionality for standard metrology applications. However for the measurement of high quality precision synchrotron optics, increased or improved functionality is often required. Furthermore, it is impossible to determine, verify, or modify the algorithm that has been implemented in a closed‑source commercial software package. The process of generating a detailed report for each optical component can also be very tedious and time consuming. The data from each instrument is analyzed using the corresponding commercial software packages. This analysis is recorded, typically with a screen capture, to be later inserted into the report document. If analysis is needed that is beyond the capabilities of the provided software, then the data must be exported to another custom software package. A summary is then created manually, typically by tabulating all of the results. This process must be repeated for each optical component measured. It is prone to error and very difficult to automate. The CLS Optical Metrology Facility has begun developing software to address the above mentioned deficiencies in our commercial software. The goal of this software is to provide advanced analysis functionality for all three metrology instruments, pre-/post-processing, as well as support for automation and report generation. The core functionality to be implemented includes error analysis, curve fitting, and power spectral density (PSD) for both profile (1D) and surface (2D) data. This software has been developed in C/C++ using the ROOT data analysis framework [Brun et al.]. ROOT is an open source package being developed at CERN and provides many advanced analytical and graphical features. Currently the software is in the development and testing stages with a focus on curve fitting for the analysis of LTP and FI data. Figure 1 (on the right) shows the results of a spherical fit (actually a polynomial approximation) to FI height data for a CLS VESPERS beamline KB mirror. The surface height data was calculated by averaging three FI measurements acquired successively. The surface height uncertainty was calculated from the variation in the original measurements. A data window has been applied to select only the clear aperture of the mirror. The best fit piston (z = C), tilt (z = Ax + By +C), power (z = D(x2 + y2) + Ax + By + C) and twist (z = Fxy + Ax + By + C + Dx2 + Ey2)) were then individually removed from both the height data and height uncertainty data. The resulting surface height plot is shown in the left graph of Figure 1, with a histogram of the surface height data below. The resulting surface height uncertainty is shown in the right plot, with a corresponding histogram below. The histograms are useful to verify whether the distributions are approximately normal or not. The root mean square (RMS) and mean values of the surface height plot are displayed in the upper left results box, along with the respective errors calculated from the height uncertainty plot. The upper right results box displays the radius of curvature and the fitted parameter results, all with their respective errors. This particular KB mirror has a height error of 0.0115 ± 0.0002 µm and a radius of curvature of 42591 ± 605 m. These results are formatted such that they can be easily printed, or combined with others to generate a comprehensive report. References: Rene Brun and Fons Rademakers, ROOT - An Object Oriented Data Analysis Framework, Proceedings AIHENP'96 Workshop, Lausanne, Sep. 1996, Nucl. Inst. & Meth. in Phys. Res. A 389 (1997) 81-86. See also http://root.cern.ch/. Figure 1: Spherical fit of Fizeau Interferometer data for a KB mirror (VESPERS beamline). Canadian Light Source Metrology Facility – Hardware Development: An optical tip/tilt stage that can handle large synchrotron mirrors has been designed and machined (See Figure 2 below). Commercial stages were considered but discarded later for a variety of issues - stability, high cost, insufficient mirror length capability, insufficient translation range, or deficiency in tip, tilt, pitch adjustments. This flexible design can be used with all three metrological instruments in the CLS Optical Metrology Facility. The conceptual design was developed by Bruce Truax of Diffraction Limited Design LLC. This preliminary design was further refined and finalized by Siyue Chen within the CLS Engineering and Technical Services Division. The stage can handle optical elements up to 1400 mm in length and approximately 200 mm in width, and weights up to 200 kg. A lateral motion of ± 25 mm in (x,z) can be achieved using micrometers. The height (y) can be finely adjusted ± 10 mm using three finely threaded screws (750 mm per thread) that are mounted to 100 mm diameter air bearings (porous silicon carbide) from New Way. When these air bearings are pressurized the stage can be easily moved while loaded with a heavy optic, even on a tapped optical table. The stage has sufficient rotational degrees of freedom (tip, tilt, pitch) to allow for alignment of the optical element (See Figure 2). A retroreflector mount is provided to accommodate a distance measurement interferometer (DMI), which is useful for radius bench measurements on short radius spherical or cylindrical optics (R < 2 m). Figure 3 shows the underside of the optical table and gives a good view of the air bearings and ribbed support structure that provides rigidity. Figure 4 shows the mounting base for the table – complete with the pivot post that holds the spherical bearing (Figure 5), micrometers to move the mounting base laterally (x,z), and cut-outs to allow for rotation of the table through 180°. A symmetrical design allows for two possible configurations, which provides for either clockwise or counter-clockwise rotation of the table. The lateral micrometers (x,z) can be removed to mount the radius bench measurement guide bar (2 m), which allows the table and mount to be moved longitudinally (z). Figure 5 shows the rail release mechanism and cam followers (see also Figure 4) used for the radius bench measurement. Currently the stage is undergoing testing with the Fizeau Interferometer, and will be used for measuring the Phase II beamline optical components. Retroreflector Mount (for DMI Laser + Radius Bench Measurement) Retroreflector Mount Cam follower (radius bench measurement) Air Supply Pitch New Way air bearing (100 mm) - SiC Micrometers for lateral (x) and along beam (z) adjustments y Tilt z Cut-out to allow rotation of table (New Way air bearing) Rotational scale with pivot post below (not visible, see Figure 4) – pitch rotation of table used for grazing measurements x Tip Pivot Post for spherical bearing Tension spring required for micrometer movement Mounting Base securing screw with teflon spacer interface Micrometers for lateral (x,z) adjustments Figure 4: Mounting Base for Table, showing pivot post, translation micrometers, retroreflector mount. Removable handles Cam Follower Figure 2: CLS optical tip/tilt stage (top-down view) to handle large synchrotron optics. Spherical Bearing (mounts to Pivot Post) Rail Release – attaches to mounting base for radius bench measurement Fine Pitch adjustment for table Compression Spring New Way air bearing height adjustment (750 mm per thread) Figure 5: Miscellaneous components Figure 3: Side View showing ribbed support structure and New Way air bearings.