Download
1 / 78
790 likes | 840 Views
Understand data clustering methods for various data types like numeric, binary, categorical, and text through distance metrics and cost functions. Learn about K-means variants, entropy-based cost functions, and iterative algorithms.

E N D
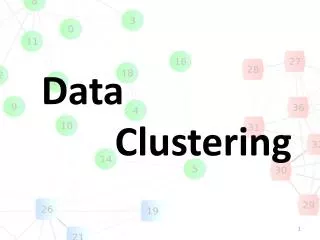
Clustering different types of data Pasi Fränti 21.3.2017
Numeric Binary Categorical Text Time series Data types
Definition of distance metric A distance function is metric if the following conditions are met for all data points x, y, z: • All distances are non-negative: d(x, y) ≥ 0 • Distance to point itself is zero: d(x, x) = 0 • All distances are symmetric: d(x, y) = d(y, x) • Triangular inequality: d(x, y) d(x, z) + d(z, y)
Minkowski distance Euclidean distance q = 2 Manhattan distance q = 1 Common distance metrics 1st dimension 2nd dimension pth dimension Xj = (xj1, xj2, …, xjp) dij = ? Xi = (xi1, xi2, …, xip)
2D example x1 = (2,8) x2 = (6,3) Euclidean distance Manhattan distance Distance metrics example 10 5 0 5 10 X1 = (2,8) 5 X2 = (6,3) 4
Chebyshev distance In case of q , the distance equals to the maximum difference of the attributes. Useful if the worst case must be avoided: Example:
Hierarchical clusteringCost functions • Three cost functions exist: • Single linkage • Complete linkage • Average linkage
Single Link The smallest distance between vectors in clusters i and j: Cluster 1 Cluster 2 xi Min distance xj
Complete Link The largest distance between vectors in clusters i and j: Cluster 1 Cluster 2 xj Max distance xi
Average Link The average distance between vectors in clusters i and j: Cluster 1 Cluster 2 Av. distance xj xi
Cost function example[Theodoridis, Koutroumbas, 2006] 1 1.1 1.2 1.3 1.4 1.5 x1 x1 x1 x2 x2 x2 x3 x3 x3 x4 x4 x4 x5 x5 x5 x6 x6 x6 x7 x7 x7 Data Set Single Link: Complete Link:
Hamming Distance(Binary and categorical data) Number of different attribute values. Distance of (1011101) and (1001001) is 2. Distance (2143896) and (2233796) Distance between (toned) and (roses) is 3. 100->011 has distance 3 (red path) 010->111 has distance 2 (blue path) 3-bit binary cube
Hard thresholding of centroid (0.40, 0.60, 0.75, 0.20, 0.45, 0.25)
Hard and soft centroids Bridge (binary version)
Distance and distortion General distance function: Distortion function:
Distortion for binary data Cost of a single attribute: The number of zeroes is qjk, the number of ones is rjkand cjk is the current centroid value for variable k of group j.
Optimal centroid position Optimal centroid position depends on the metric. Given parameter: The optimal position is:
Categorical clustering Three attributes
Categorical clustering Sample 2-d data: color and shape Model A Model B Model C
Hamming Distance(Binary and categorical data) • Number of different attribute values. • Distance of (1011101) and (1001001) is 2. • Distance (2143896) and (2233796) • Distance between (toned) and (roses) is 3. 100->011 has distance 3 (red path) 010->111 has distance 2 (blue path) 3-bit binary cube
K-means variants Histogram-based methods: Methods: • k-modes • k-medoids • k-distributions • k-histograms • k-populations • k-representatives
Category utility: Entropy-based cost functions Entropy of data set: Entropies of the clusters relative to the data:
K-modes clusteringDistance function Vector and mode A F I A D G Distance +1 2 +1
K-modes clusteringPrototype of cluster Vectors Mode A D G B D H A F I A D
K-medoids clusteringPrototype of cluster Vector with minimal total distance to others 3 Medoid: 2 2 A C E B C F B D G B C F 2+3=5 2+2=4 2+3=5
K-histograms D 2/3 F 1/3
Literature Modified k-modes + k-histograms:M. Ng, M.J. Li, J. Z. Huang and Z. He, On the Impact of Dissimilarity Measure in k-Modes Clustering Algorithm, IEEE Trans. on Pattern Analysis and Machine Intelligence, 29 (3), 503-507, March, 2007. ACE:K. Chen and L. Liu, The “Best k'' for entropy-based categorical data clustering, Int. Conf. on Scientific and Statistical Database Management (SSDBM'2005), pp. 253-262, Berkeley, USA, 2005. ROCK:S. Guha, R. Rastogi and K. Shim, “Rock: A robust clustering algorithm for categorical attributes”, Information Systems, Vol. 25, No. 5, pp. 345-366, 200x. K-medoids:L. Kaufman and P. J. Rousseeuw, Finding groups in data: an introduction to cluster analysis, John Wiley Sons, New York, 1990. K-modes:Z. Huang, Extensions to k-means algorithm for clustering large data sets with categorical values, Data mining knowledge discovery, Vol. 2, No. 3, pp. 283-304, 1998. K-distributions:Z. Cai, D. Wang and L. Jiang, K-Distributions: A New Algorithm for Clustering Categorical Data, Int. Conf. on Intelligent Computing (ICIC 2007), pp. 436-443, Qingdao, China, 2007. K-histograms:Zengyou He, Xiaofei Xu, Shengchun Deng and Bin Dong, K-Histograms: An Efficient Clustering Algorithm for Categorical Dataset, CoRR, abs/cs/0509033, http://arxiv.org/abs/cs/0509033, 2005.
Applications of text clustering • Query relaxation • Spell-checking • Automatic categorization • Document clustering
Query relaxation Alternate solutionFrom semantic clustering Current solutionMatching suffixes from database
Spell-checking Word kahvila (café): • one correct • two incorrect spellings
Automatic categorization Category by clustering
Motivation: Group related documents based on their content No predefined training set (taxonomy) Generate a taxonomy at runtime Clustering Process: Data preprocessing: tokenize, remove stop words, stem, feature extraction and lexical analysis Define cost function Perform clustering Document clustering
String similarity is the basis for clustering text data A measure is required to calculate the similarity between two strings Text clustering
Semantic: car and auto отельand Гостиница лапкаand слякоть Syntactic: automobile and auto отельand готель saunaand sana String similarity
object artifact instrumentality article conveyance, transport ware vehicle table ware wheeled vehicle cutlery, eating utensil fork bike, bicycle automotive, motor car, auto truck Semantic similarity Lexical database: WordNet English Relations via generalization Sets of synonyms (synsets)
Input : word1: wolf , word 2: hunting dog Output: similarity value = 0.89 Similarity using WordNet [Wuand Palmer, 2004]
Hierarchical clustering by WordNet Need better