Download
1 / 39
390 likes | 417 Views
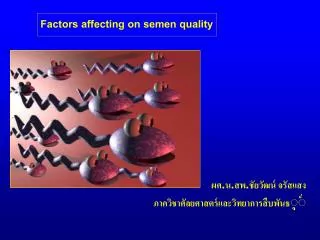
Investigating the impact of pesticide exposure on semen quality to understand global trends in male fertility decline. The study analyzes geographic variations and pesticide associations in men's semen samples.

E N D
Semen quality in relation to exposure to currently used pesticides Shanna H. Swan, PhD University of Missouri-Columbia 6th International Symposium on Environmental Endocrine Disrupters Sendai, Japan December 5, 2003
Background (1) Background (1) In 1992 Carlsen et al. reported a 50% global decline in sperm concentration This trend, supported by re-analyses, was seen to vary geographically
Since some analyses found no decline, a global trend is still disputed.
Background (2) • After 1992, many publications reported significant geographic variation in sperm concentration These uncontrolled comparisons were difficult to interpret
Background (3) Well-controlled, multi-center studies were needed to demonstrate real geographic variation in semen quality A world-wide collaboration of multi-center studies was begun in 1997.
One of these compared four European cities Copenhagen Paris Edinburgh Turku Concentration (106/ml) 84 88 102 113 Motile sperm (%) 63 58 68 67 Normal morphology (%) 48 50 50 52 (Jorgensen et. al, 2001) Sperm concentration in Copenhagen, Denmark was 74% of that in Turku, Finland.
The Study for Future Families(SFF) In 1998, we obtained funding for a multi-center study of pregnant women and their partners to compare semen quality and other reproductive endpoints among US cities.
The First Four Clinical Centers of the Study for Future Families
SFF Recruitment: Pregnant woman with appointments at study clinics were contacted to determine eligibility 36 % of potential subjects were ineligible 55% of eligible subjects refused participation 24% of eligible men gave a semen sample
Study Population Characteristics Men with at least 1 semen sample
Comparing semen quality among centers • Semen parameters included; sperm concentration, volume, motility (motion) and morphology (shape) • Initial comparisons among centers were unadjusted and used raw values • Regression models, using log transformed data, were used to control for confounding
Summary of Semen Parameters * * * *P-Value for MO vs. all other centers <.001
Semen Quality by Center Men in Mid-Missouri have only 56% as many moving sperm as men in urban Minneapolis
Can differences between the populations at these centers explain the poor semen quality in men from mid-Missouri?
No: We considered these factors • Ethnicity • Recent fever • Abstinence time • Analysis time • Age • Smoking • History of infertility • Body mass index (BMI) • History of STDS Differences in semen quality were unchanged by adjustment for these factors
Can differences between centers’ methods of semen analysisaccount for these differences in semen quality?
No: Semen analyses were tightly controlled • All labs used the same protocols and standard equipment • Technicians were centrally trained • Standard samples sent quarterly for quality control
QC data for MO and MN compared to “Gold standard” Technician Sperm Concentration %Motile Sperm Gold Standard 51% 81.3 (x 106/ml) MN 72.6 (x 106/ml) 47% MO 49% 74.6 (x 106/ml) MO and MN were similar and slightly lower than standard
We sought causes of our findings, looking first in MO and MN: Why? • Sample sizes, participation rates and populations were similar in these centers • Quality control results were also similar • But semen parameters differed significantly The remainder of this talk will compare these two centers.
% Acres in farms and use of pesticides Pesticides applied (acres) Population Density SFF Center % Acres in Farms Insecticides Herbicides Fertilizer MO 164 57% 60,125 8,162 49,863 MN 1,855 19% 29,901 4,627 28,704
Study hypothesis One or more pesticides widely used in agriculture in mid-Missouri, but not in Minneapolis, MN, contributes to the difference in semen quality between these two centers
How did we examine this hypothesis? • Men’s urine samples were assayed for pesticide metabolites by the Centers for Disease Control (CDC). • CDC was blinded to men’s semen quality or city of residence. • We first compared pesticide metabolites in the urine of MO and MN men. Then, we compared pesticide metabolites in two groups of MO men (cases and controls)
Pesticides found more often in MN • Chlorpyrifos ,1-Napthol and 4-Nitrophenol • None were primarily used in farming • None were related to semen quality • These were not studied further Remaining analyses limited to men from mid-Missouri
MO men selected for pesticide analysis Cases • 25 men with poor semen quality • Mean sperm concentration: 32.4 x 10⁶/ml Controls • 25 men with normal semen quality • Mean sperm concentration: 72.2 x 10⁶/ml All semen parameters were significantly lower in cases
Pesticides detected more often in cases than controls Percent of men with pesticide > LOD
Five pesticides were associated with semen quality in MO men: Three were strongly associated *Wilcoxon rank test
Two pesticides were weakly associated with sperm count *Wilcoxon rank test
Dose response for alachlor in MO men Alachlor Level Cases Odds Ratio(95% CI) Controls <0.15 3 15 REF 0.15-0.7 10 8 6.3 (1.3-29.4) >0.7 12 2 30.0 (4.3-210) 25 25 Total Participants Though numbers are small, trend is highly statistically significant
What if a man was exposure to more than one of the five associated pesticides? Percent of men with poor semen quality Number of pesticides at high levels
How are men being exposed? • Because of pesticides’ short half-life in the body, exposure is recent • Men are not farmers, so exposure is environmental; dermal exposure is unlikely • These pesticides are not volatile; inhalation is unlikely Therefore, ingestion is the likely route of exposure
Drinking water is a likely source of exposure • These pesticides are commonly found in drinking water sources • These pesticides are not removed by routine water treatment US Geological Survey, 2001
Examining pesticides and semen quality in a second agricultural center • Iowa City, IA and Columbia, MO have: • Same population density • Comparable demographics • Center staff trained in all SFF methods • We will recruit 200 IA couples for SFF • Results now available on 50 IA men
What is needed? • Urinary pesticide levels in IA men • Serum levels of pesticides to examine total exposure • Tap water pesticide levels • Replication of study in other areas and countries
The Study for Future Families Shanna Swan (U MO) Jim Overstreet (UC Davis) Principal Investigator Andrology Center Director Erma Drobnis (U MO) Maureen Hatch (Mt. Sinai) Clinical Center Director Clinical Center Director Bruce Redmon (U MN) Christina Wang (UCLA) Clinical Center Director Clinical Center Director Amy Sparks (U IA) Dana Barr (CDC) Clinical Center Director Biomarker Analyses Funded by grants from the National Institute of Environmental HealthSciences and the Environmental Protection Agency.