Download
1 / 17
170 likes | 192 Views
Study on hydraulic parameters by Paul Inkenbrandt in the A1/A2 Qal Tsl area, including aquifer specific capacity distribution data. Analyzing water levels with snow accumulation insights from various monitoring sites.

E N D
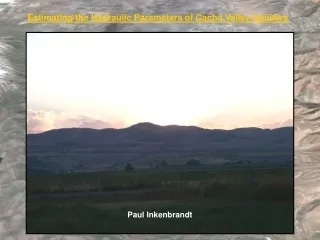
Estimating the Hydraulic Parameters of Cache Valley Aquifers Paul Inkenbrandt
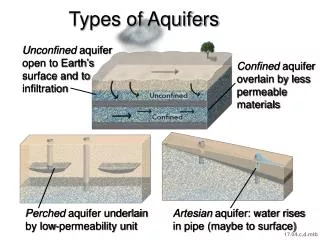
A1/A2 Qal Tsl Conceptual Diagram of Hydrogeologic Setting Olsen, 2007
Division of Water Well Records http://www.waterrights.utah.gov/
My Database http://www.waterrights.utah.gov/
Screened Aquifer Units http://www.waterrights.utah.gov/
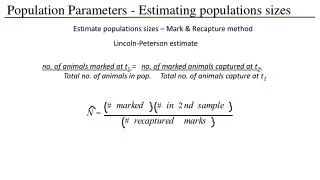
Q sc = s Q s Specific Capacity
Principle Aquifer Specific Capacity Distribution http://www.waterrights.utah.gov/
Alluvium Specific Capacity Distribution http://www.waterrights.utah.gov/
Salt Lake Fm Specific Capacity Distribution http://www.waterrights.utah.gov/
Water Levels and Tony Grove Snow Accumulation http://www.bearriverinfo.org SNOTEL Site # 823 http://nwis.waterdata.usgs.gov/usa/nwis/gwlevels
Water Levels and Logan Station Precipitation Gauge http://climate.usurf.usu.edu Logan Radio KNVU http://nwis.waterdata.usgs.gov/usa/nwis/gwlevels
Piezometric Surface Using Division of Water Data http://www.waterrights.utah.gov/
Mean and Median Piezometric Surface Elevation http://nwis.waterdata.usgs.gov/usa/nwis/gwlevels
Change in Water Level Elevation http://nwis.waterdata.usgs.gov/usa/nwis/gwlevels
1970 1980 1990 1960 2000 Up N E S W Down 4800 4600 Vertical ft http://nwis.waterdata.usgs.gov/usa/nwis/gwlevels