Download
1 / 14
150 likes | 399 Views
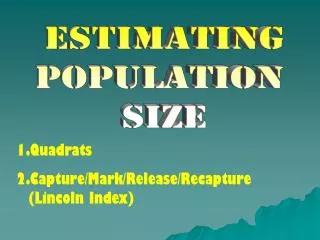
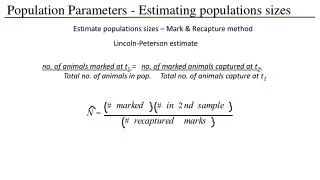
Population Parameters - Estimating populations sizes. Estimate populations sizes – Mark & Recapture method. Lincoln-Peterson estimate. no. of animals marked at t 1 = no. of marked animals captured at t 2 . Total no. of animals in pop. Total no. of animals capture at t 2.

E N D
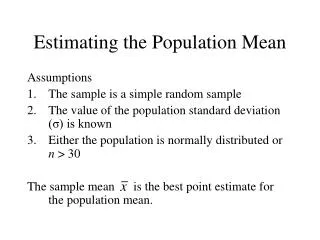
Population Parameters - Estimating populations sizes Estimate populations sizes – Mark & Recapture method Lincoln-Peterson estimate no. of animals marked at t1= no. of marked animals captured at t2. Total no. of animals in pop. Total no. of animals capture at t2
Population Parameters - Estimating populations sizes Lincoln-Peterson estimate no. of animals marked at t1 = no. of marked animals captured at t2. Total no. of animals in pop. Total no. of animals capture at t2 10 marked at t1= 1 animal captured at t2. Total no. 100 10 animals capture at t2 1111111111 10 10 10 10 10 10 10 10 10 10
Population Parameters - Estimating populations sizes Lincoln-Peterson estimate • Assumptions • Marked and unmarked animals must have equal chance of being captured. • - Implications for marking method. • There must be enough time between sample t1 sample t2 for marked animals to intermix with the rest of the population. • The population must be closed. No No immigration, no emigration, no births, no deaths. • Inherent biases in sampling are the same for each sample time t1 & t2. • Animals do not lose their marks. Obvious, but…
Population Parameters - Estimating populations sizes Estimate populations sizes – Index of relative abundance Length of meadow vole runways (built under the snow).
Population Parameters - Estimating populations sizes Estimate populations sizes – Index of relative abundance Estimating pheasant populations through roadside surveys
Population Parameters – Life Tables • Cohort life table -survivorship directly observed. This is where a large cohort – all born at the same time- are followed throughout their lives. • Static life table- age at death observed. This is a and represents the type of data that you collecedtfor your cemetery demography lab. • Age structure directly observed. This method involves determining the ages of the living members of a population.
Population Parameters – Survivorship Curves • Survivorship curves are plotted logarithmically on the y-axis for two reasons: • 1. A very tall graph is avoided. • 2. On a log scale, equal distances on the Y-axis represent equal ratios which can be used to compare relative changes rather than absolute amounts of change. • This permits comparing rates of mortality among populations of different sizes.
Population Parameters – Survivorship Curves Type II Survivorship curve for three species of Turdus: T. merula, the European blackbird; T. philomelos, the song thrush; and T. migratorius, the American robin.