Download
1 / 12
130 likes | 179 Views
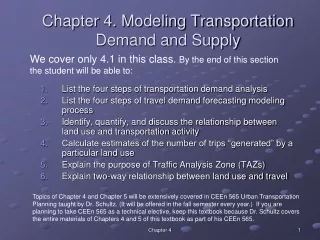
Learn the modeling process for transportation demand analysis, forecasting, and the relationship between land use and travel activities. Topics include trip generation estimates and Traffic Analysis Zones (TAZs). This text is essential for CEEn 565.

E N D
We cover only 4.1 in this class. By the end of this section the student will be able to: Chapter 4. Modeling Transportation Demand and Supply List the four steps of transportation demand analysis List the four steps of travel demand forecasting modeling process Identify, quantify, and discuss the relationship between land use and transportation activity Calculate estimates of the number of trips “generated” by a particular land use Explain the purpose of Traffic Analysis Zone (TAZs) Explain two-way relationship between land use and travel Topics of Chapter 4 and Chapter 5 will be extensively covered in CEEn 565 Urban Transportation Planning taught by Dr. Schultz. (It will be offered in the fall semester every year.) If you are planning to take CEEn 565 as a technical elective, keep this textbook because Dr. Schultz covers the entire materials of Chapters 4 and 5 of this textbook as part of his CEEn 565. Chapter 4
Mythaca’s congestion problem now(SR361) Chapter 4
Mythaca’s congestion problem(SR361): one solution (bypass) and change in traffic Chapter 4
4.1.1 Anticipating future network needs Transportation planning is a process that involves: • the analysis of current travel patterns, • the forecasting of future travel patterns (Transportation Demand Analysis), • the proposal of transportation infrastructure and services, and • the evaluation of proposed alternative projects to be considered by decision makers for implementation The result is a plan – A set of improvements to be considered by decision makers. Basic concepts of travel demand modeling: • Travel demand is a derived demand • Travel patterns are influenced by land use • Individuals’ decision making habits influence travel demand http://www.envisionutah.org Chapter 4 http://www.mountainland.org/
4-step transportation demand forecasting modeling process (and this is what covered in this section.) • Preparation: population and economic analysis and land use analysis Chapter 4
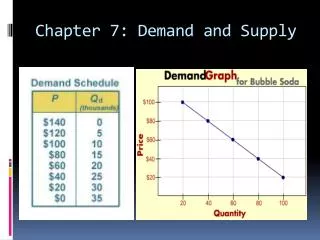
Travel demand forecasting modeling process (4-step model) • Should I make a trip? • What should be my destination? • What mode of transportation should I use? • What route or path should I take? p.4.5 Think About It: Think back to the last four or five trips you made. Did you ask yourself any or all of the four questions above? If so, in what order did you consider the questions. Chapter 4
Analysis zones for transportation study (TAZ) First, we need to divide the study area into smaller zones of (hopefully) uniform land use Dense area, in terms of population and businesses, has more zones. Zones usually get larger in less dense areas. More reasonable to use TAZ than a site-by-site analysis when regional planning is done. Standard trip generation methods: • site-based • zone-based • household-based Chapter 4
Link-node map for highway system • Link-node maps are the starting point for the 4-step transportation demand forecasting process Chapter 4
Graphical way of understanding the 4-step demand forecasting process 200 trips from zone 46 to zone 29 1000 trips attracted to zone 29: employment center 1000 trips generated in zone 46: residential area zone 70% this route (140 trips) Auto total: 95%(190 trips) Public transit: 5%(10 trips) 25% this route (50 trips) Chapter 4
4.1.2 Land use and tripmaking Finding how many trips are generated from a zone is the first step of urban transportation demand modeling. At a macro level, it is a region wide demand forecasting and at a micro levelthe public agency wants to know how many trips a development in a land can produce – like how many trips a planned Walmart might produce. Tripmakers Transportation facilities Land use MAG’s 2040 Transportation Plan Demand Forecasting Chapter 4
Estimating the number of trips generated: CEEn 565 deals with various methods to do this step, but in this lecture, we use charts found in the ITE Trip Generation Handbook to show you how to get quickly ballpark estimates – and of course there are a few pitfalls... (Walk through Example 4.1.) Chapter 4