Download
1 / 87
871 likes | 1.08k Views
ECONOMICS 5e. Michael Parkin. CHAPTER 4 Demand and Supply. Learning Objectives. Distinguish between a money price and a relative price Explain the main influences on demand Explain the main influences on supply

E N D
ECONOMICS 5e Michael Parkin CHAPTER 4Demand and Supply
Learning Objectives • Distinguish between a money price and a relative price • Explain the main influences on demand • Explain the main influences on supply • Explain how prices and quantities bought and sold are determined by demand and supply
Learning Objectives (cont.) • Explain why some prices fall, some rise, and some fluctuate • Use demand and supply to make predictions about price changes
Learning Objectives • Distinguish between a money price and a relative price • Explain the main influences on demand • Explain the main influences on supply • Explain how prices and quantities bought and sold are determined by demand and supply
Price and Opportunity Cost Price is the number of dollars that must be given up in exchange for an item — this is referred to as the money price. The ratio of one price to another is referred to as the relative price. Relative prices are opportunity costs.
Price and Opportunity Cost • Relative Prices • price index • Supply and demand determines relative prices. • “Price falling” means the price falls relative to the average price of other goods and services.
Learning Objectives • Distinguish between a money price and a relative price • Explain the main influences on demand • Explain the main influences on supply • Explain how prices and quantities bought and sold are determined by demand and supply
Demand If a person demands something, they: • Want it. • Can afford it. • Have made a definite plan to buy it. Wants are the unlimited desires or wishes that people have for goods and services.
Demand The quantity demanded of a good or service is the amount that consumers plan to buy during a given time period at a particular price.
Demand What determines buying plans? • The price of the good • The prices of related goods • Expected future prices • Income • Population • Preferences
Demand The Law of Demand Other things remaining the same, the higher the price of a good, the smaller is the quantity demanded. Reasons for the Law of Demand • Substitution Effect • Income Effect
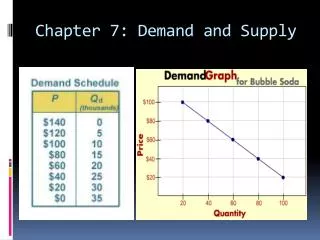
Demand Demand Curve and Demand Schedule Demand curves show the relationship between the quantity demanded of a good and its price (ceteris paribus). Demand schedules list the quantities demanded at each different price (ceteris paribus).
Demand a 1 9 b 2 6 c 3 4 d 4 3 e 5 2 Price Quantity (dollars per tape) (millions of tapes per week)
e d c b a Demand 6 5 Price (dollar per tape) 4 3 Demand for tapes 2 1 0 2 4 6 8 10 Quantity (millions of tapes per week)
Demand A Change in Demand When any factor that influences buying plans other than the price of the good changes, there is a change in demand. • An increase in demand causes the demand curve to shift rightward. • A decrease in demand causes the demand curve to shift leftward.
A Change in Demand Price of Related Goods • Substitutes - goods used in the place of another good • Complements - goods used in conjunction with another good What Happens to Demand if the price of a substitute good increases? A complement?
A Change in Demand Expected Future Prices • If the price of a good is expected to rise in the future, people buy more of the good now. • If the price of a good is expected to fall in the future, people buy less of the good now.
A Change in Demand Income • Normal Goods — demand increases as income increases • Inferior Goods — demand decreases as income increases
A Change in Demand Population • Size and age structure Preferences • Attitudes toward goods and services
Price (dollars per tape) New demand schedule Original demand schedule Walkman $200 Walkman $50 Quantity Quantity Price (dollars per tape) (millions of tapes per week) (millions of tapes per week) a 1 9 Assume the original price of Walkmans is $200. The demand schedule shows the Price-Quantity relationship for tapes. b 2 6 c 3 4 d 4 3 e 5 2
Price (dollars per tape) New demand schedule Original demand schedule Walkman $200 Walkman $50 Quantity Quantity Price (dollars per tape) (millions of tapes per week) (millions of tapes per week) a' 1 a 1 9 13 10 b 2 6 b' 2 8 c' 3 c 3 4 d' 4 7 d 4 3 e' 5 6 e 5 2
e e' d d' c c' b b' a a' Demand 6 Demand for tapes (Walkman $50) 5 Price (dollar per tape) 4 3 2 Demand for tapes (Walkman $200) 1 0 2 4 6 8 10 12 14 Quantity (millions of tapes per week)
The Demand for Tapes The Law of Demand The quantity of tapes demanded Decreases if: the price of a tape rises. Increases if: the price of a tape falls.
The Demand for Tapes Changes In Demand The demand for tapes Decreases if: • the price of a substitute falls. • the price of a complement rises. • income falls (a tape is a normal good). • the population decreases. • the price of a tape is expected to fall in the future.
The Demand for Tapes Changes In Demand The demand for tapes Increases if: • the price of a substitute rises. • the price of a complement falls. • income rises (a tape is a normal good). • the population increases. • the price of a tape is expected to rise in the future.
A Change in the Quantity Demanded Versus a Change in Demand A movement along a demand curve, which results from a change in price, shows a change in the quantity demanded. If some other influence on buyers’ plans changes, holding price constant, there is a change in demand.
Decrease in quantity demanded Increase in Decrease in demand demand Increase in quantity demanded D1 D2 A Change in the Quantity Demanded Versus a Change in Demand Price D0 Quantity
Learning Objectives • Distinguish between a money price and a relative price • Explain the main influences on demand • Explain the main influences on supply • Explain how prices and quantities bought and sold are determined by demand and supply
Supply If a firm supplies a good or service, the firm • has the resources and technology to produce it. • can profit from producing it. • has made a definite plan to produce it and sell it.
Supply The quantity supplied of a good or service is the amount that producers plan to sell during a given time period at a particular price.
Supply What determines selling plans? • The price of the good • The prices of resources used to produce the good • The prices of related goods produced • Expected future prices • The number of suppliers • Technology
Supply The Law of Supply Other things remaining the same, the higher the price of a good, the greater is the quantity supplied.
Supply Supply Curve and Supply Schedule Supply curves show the relationship between the quantity supplied of a good and its price (ceteris paribus). Supply schedules list the quantities supplied at each different price (ceteris paribus).
Supply Price Quantity (dollars per tape) (millions of tapes per week) a 1 0 b 2 3 c 3 4 d 4 5 e 5 6
Supply of Tapes e d c b a Supply 6 5 Price (dollar per tape) 4 3 2 1 0 2 4 6 8 10 Quantity(millions of tapes per week)
Supply A Change in Supply When any factor that influences selling plans other than the price of the good changes, there is a change in supply. • An increase in supply causes the supply to shift rightward. • A decrease in supply causes the supply curve to shift leftward.
A Change in Supply • Price of Productive Resources • Price of Related Goods Goods Produced • Substitutes in Production • Complements in Production • Expected Future Prices
A Change in Supply • The Number of Suppliers • Technology
Price (dollars per tape) Supply Original supply schedule New supply schedule Old technology New technology Quantity Quantity Price (dollars per tape) (millions of tapes per week) (millions of tapes per week) 3 a 1 0 a' 1 b' 2 6 b 2 3 c' 3 8 c 3 4 10 d' 4 d 4 5 e' 5 12 e 5 6
e' d' c' b' a' Supply Supply of tapes (old technology) 6 5 e Price (dollar per tape) 4 d 3 c 2 b Supply of tapes (new technology) 1 a 0 2 4 6 8 10 12 14 Quantity (millions of tapes per week)
The Supply of Tapes The Law of Supply The quantity of tapes supplied Decreases if: the price of a tape falls. Increases if: the price of a tape rises.
The Supply of Tapes Changes In Supply The supply of tapes Decreases if: • The price of a resource used to produce tapes rises. • The number of tape producers decreases. • The price of a substitute in production rises.
The Supply of Tapes Changes In Supply The supply of tapes (cont.) Decreases if: • The price of a complement in productionfalls. • The price of a tape is expected to rise in the future.
The Supply of Tapes Changes In Supply The supply of tapes Increases if: • The price of a resource used to produce tapes falls. • More efficient technologies for producing tapes are discovered. • The number of tape producers increases.
The Supply of Tapes Changes In Supply The supply of tapes (cont.) Increases if: • The price of a substitute in production falls. • The price of a complement in production rises. • The price of a tape is expected to fall in the future.
A Change in the Quantity Supplied Versus a Change in Supply A movement along a supply curve, which results from a change in price, shows a change in the quantity supplied. If some other influence on sellers’ plans changes, holding price constant, there is a change in supply.
Increase in quantity supplied S2 S1 Decrease in Increase in supply supply Decrease in quantity supplied A Change in the Quantity Supplied Versus a Change in Supply S0 S0 Price Quantity
Learning Objectives • Distinguish between a money price and a relative price • Explain the main influences on demand • Explain the main influences on supply • Explain how prices and quantities bought and sold are determined by demand and supply
Market Equilibrium Equilibrium in a market occurs when the price balances the plans of buyers and sellers. Equilibrium price is the price at which quantity demanded equals quantity supplied. Equilibrium quantity is the quantity bought and sold at the equilibrium price.