Download
1 / 59
590 likes | 617 Views
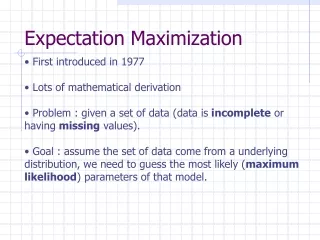
Learn about EM algorithm for Gaussian mixture, hidden variables, and Gaussian distribution functions. Explore basic theory and practical examples. Understand peak probability values in Gaussian functions.

E N D
Ch15. Expectation Maximization for Gaussian mixture KH Wong Ch15. Expectation Maximization .9b
Overview • Introduction, • Problem definition • Basic Theory: (i) Probability, likelihood and log-likelihood functions, (ii) Gaussian mixture • EM algorithm and example • Further theory • Summary Ch15. Expectation Maximization .9b
Problem definition • You only have the overall envelop measurement • Find latent (hidden) variables: standard deviations (1,2,3) and means (µ1,2,3) of the three Gaussian distributions. The envelope is the measurement of the Gaussian mixture The overall probability is a combination of three unknown Gaussian distributions 1,2,3,µ1,2,3 One of the Gaussian distribution functions : standard deviation (2)and mean (µ2) https://prateekvjoshi.com/2013/06/29/gaussian-mixture-models/ Ch15. Expectation Maximization .9b
Basic theory of EM Ch15. Expectation Maximization .9b
Theory –part (i) Probability, likelihood and log-likelihood functions of a single Gaussian function https://www.statlect.com/fundamentals-of-statistics/normal-distribution-maximum-likelihood Ch15. Expectation Maximization .9b
Gaussian distribution • %2-D Gaussian distribution P(xj) • %matlab code---------- • clear, N=10 • [X1,X2]=meshgrid(-N:N,-N:N); • sigma =2.5;mean=[3 3]' • G=1/(2*pi*sigma^2)*exp(-((X1-mean(1)).^2+(X2-mean(2)).^2)/(2*sigma^2)); • G=G./sum(G(:)) %normalise it • 'sigma is ', sigma • 'sum(G(:)) is ',sum(G(:)) • 'max(max(G(:))) is',max(max(G(:))) • figure(1), clf • surf(X1,X2,G); • xlabel('x1'),ylabel('x2') Ch15. Expectation Maximization .9b
Worksheet1 (Given : =2, (mean_x,mean_y)=(4,4)) x=mx y=my x=1+mx y=my Position (0,0) • Fill in the blanks of this Gaussian function of size 9x9 , sigma ()=2,(mean_x, mean_y)=(4,4) • Sketch the function • G(x,y)= • 0.0007 0.0017 0.0033 0.0048 0.0054 0.0048 0.0033 0.0017 0.0007 • 0.0017 0.0042 0.0078 0.0114 0.0129 0.0114 0.0078 0.0042 0.0017 • 0.0033 0.0078 0.0146 0.0213 0.0241 0.0213 0.0146 0.0078 0.0033 • 0.0048 0.0114 0.0213 0.0310 0.0351 0.0310 0.0213 0.0114 0.0048 • 0.0054 0.0129 0.0241 0.0351 ____? ____? 0.0241 0.0129 0.0054 • 0.0048 0.0114 0.0213 0.0310 0.0351 ____? 0.0213 0.0114 0.0048 • 0.0033 0.0078 0.0146 0.0213 0.0241 0.0213 0.0146 0.0078 0.0033 • 0.0017 0.0042 0.0078 0.0114 0.0129 0.0114 0.0078 0.0042 0.0017 • 0.0007 0.0017 0.0033 0.0048 0.0054 0.0048 0.0033 0.0017 0.0007 Ch15. Expectation Maximization .9b
Answer1(Given : =2, (mean_x,mean_y)=(4,4)) 1/(2*pi*2^2)*exp(-1/8) 1/(2*pi*2^2) x=1+mx y=my x=mx y=my Position (0,0) 1/(2*pi*2^2)*exp(-2/8) • Fill in the blanks of this Gaussian function of size 9x9 , sigma ()=2, (mean_x, mean_y)=(4,4) • Sketch the function • 0.0007 0.0017 0.0033 0.0048 0.0054 0.0048 0.0033 0.0017 0.0007 • 0.0017 0.0042 0.0078 0.0114 0.0129 0.0114 0.0078 0.0042 0.0017 • 0.0033 0.0078 0.0146 0.0213 0.0241 0.0213 0.0146 0.0078 0.0033 • 0.0048 0.0114 0.0213 0.0310 0.0351 0.0310 0.0213 0.0114 0.0048 • 0.0054 0.0129 0.0241 0.0351 0.03980.0351 0.0241 0.0129 0.0054 • 0.0048 0.0114 0.0213 0.0310 0.0351 0.0310 0.0213 0.0114 0.0048 • 0.0033 0.0078 0.0146 0.0213 0.0241 0.0213 0.0146 0.0078 0.0033 • 0.0017 0.0042 0.0078 0.0114 0.0129 0.0114 0.0078 0.0042 0.0017 • 0.0007 0.0017 0.0033 0.0048 0.0054 0.0048 0.0033 0.0017 0.0007 clear %matlab sigma=2 % in matlab , no -ve index for looping, so shift center to (5,5) mean_x=5 , mean_y=5 for y=1:9 for x=1:9 g(x,y)=(1/(2*pi*sigma^2))*exp(-((x-mean_x)^2+(y-mean_y)^2) /(2*sigma^2)) end end mesh(g) title('2D Gaussian function') Ch15. Expectation Maximization .9b
Worksheet2 (Given : =2, (mean_x,mean_y)=(4,4)) 1/(2*pi*2^2)*exp(-1/8) 1/(2*pi*2^2) x=1+mx y=my x=mx y=my Position (0,0) 1/(2*pi*2^2)*exp(-2/8) • What is the peak probability value and (x,y) position of the peak? • 0.0007 0.0017 0.0033 0.0048 0.0054 0.0048 0.0033 0.0017 0.0007 • 0.0017 0.0042 0.0078 0.0114 0.0129 0.0114 0.0078 0.0042 0.0017 • 0.0033 0.0078 0.0146 0.0213 0.0241 0.0213 0.0146 0.0078 0.0033 • 0.0048 0.0114 0.0213 0.0310 0.0351 0.0310 0.0213 0.0114 0.0048 • 0.0054 0.0129 0.0241 0.0351 0.03980.0351 0.0241 0.0129 0.0054 • 0.0048 0.0114 0.0213 0.0310 0.0351 0.0310 0.0213 0.0114 0.0048 • 0.0033 0.0078 0.0146 0.0213 0.0241 0.0213 0.0146 0.0078 0.0033 • 0.0017 0.0042 0.0078 0.0114 0.0129 0.0114 0.0078 0.0042 0.0017 • 0.0007 0.0017 0.0033 0.0048 0.0054 0.0048 0.0033 0.0017 0.0007 clear %matlab sigma=2 % in matlab , no -ve index for looping, so shift center to (5,5) mean_x=5 , mean_y=5 for y=1:9 for x=1:9 g(x,y)=(1/(2*pi*sigma^2))*exp(-((x-mean_x)^2+(y-mean_y)^2) /(2*sigma^2)) end end mesh(g) title('2D Gaussian function') Ch15. Expectation Maximization .9b
Answer 2 (Given : =2, mean_x,mean_y=(4,4)) 1/(2*pi*2^2)*exp(-1/8) 1/(2*pi*2^2) x=1+mx y=my x=mx y=my Position (0,0) 1/(2*pi*2^2)*exp(-2/8) • What is thepeak probability value and (x,y) position of the peak? Answer: peak probability value= 0.0398 at (x,y)=(4,4) • 0.0007 0.0017 0.0033 0.0048 0.0054 0.0048 0.0033 0.0017 0.0007 • 0.0017 0.0042 0.0078 0.0114 0.0129 0.0114 0.0078 0.0042 0.0017 • 0.0033 0.0078 0.0146 0.0213 0.0241 0.0213 0.0146 0.0078 0.0033 • 0.0048 0.0114 0.0213 0.0310 0.0351 0.0310 0.0213 0.0114 0.0048 • 0.0054 0.0129 0.0241 0.0351 0.03980.0351 0.0241 0.0129 0.0054 • 0.0048 0.0114 0.0213 0.0310 0.0351 0.0310 0.0213 0.0114 0.0048 • 0.0033 0.0078 0.0146 0.0213 0.0241 0.0213 0.0146 0.0078 0.0033 • 0.0017 0.0042 0.0078 0.0114 0.0129 0.0114 0.0078 0.0042 0.0017 • 0.0007 0.0017 0.0033 0.0048 0.0054 0.0048 0.0033 0.0017 0.0007 clear %matlab sigma=2 % in matlab , no -ve index for looping, so shift center to (5,5) mean_x=5 , mean_y=5 for y=1:9 for x=1:9 g(x,y)=(1/(2*pi*sigma^2))*exp(-((x-mean_x)^2+(y-mean_y)^2) /(2*sigma^2)) end end mesh(g) title('2D Gaussian function') Ch15. Expectation Maximization .9b
Theory –part (ii) Gaussian mixture function (not single Gaussian) https://www.statlect.com/fundamentals-of-statistics/normal-distribution-maximum-likelihood http://melodi.ee.washington.edu/people/bilmes/mypapers/em.pdf https://scikit-learn.org/stable/modules/mixture.html Ch15. Expectation Maximization .9b
A tutorial • See probibilty.pptx (http://www.cse.cuhk.edu.hk/~khwong/www2/cmsc5707/probability.pptx ) • http://web.iitd.ac.in/~sumeet/GMM_said_crv10_tutorial.pdf Ch15. Expectation Maximization .9b
Gaussian mixture : The data is generated by 3 single Gaussian functions • For a Gaussian mixture of K single-Gaussians, the probability of xn being generated by the kth single Gaussian N( ) is ak • For a latent data model problem, You may not know which single Gaussian generates that data xn. But you can use the prob. akto describe the data E.g. for k=1, ak=1 =Probability that xnis by this Single Gaussian (µk=1,k=1), etc 2-D Gaussian, K=3 example https://ermongroup.github.io/cs228-notes/learning/latent/ Ch15. Expectation Maximization .9b
You may use Zk (discrete variable) or ak (continues variable) to describe the Gaussian mixture. For each sample xn has an one-hot Zk • Zk {1 or 0} is a one-hot variable telling which single Gaussian generates xn • You may describe the same structure by using the probability ak,where 0≤ ak≤1. • akis the soft version of Zk describing the same thing. k=1, ak=1 =Probability that xnis by this Single Gaussian (µk=1,k=1) Zk=1=0 Zk=2=1 k=2, ak=2 Zk=K=0 k=K, ak=K Ch15. Expectation Maximization .9b
Exercise 4Two views: discrete view(Zn,k), analog view (ak) • For each Xn, • Table TAB1 for zn,k Show 2 samples xn=1,xn=2 Zn=1,k=1=? k=1, ak=1 xn=1 Zn=1,k=2=? Zn=1,k=3=? k=2, ak=2 Zn=2,k=1=? For the whole data set ak=1=3/9 ak=2=4/9 ak=3=2/9 xn=2 Zn=2,k=2=?? Zn=2 ,k=3=? k=3, ak=3 Zk=3 Zk=1 Zk=2 Ch15. Expectation Maximization .9b The set
Why EM is used to find the latent Gaussian mixture model (GMM) ? 1-D Gaussian Ch15. Expectation Maximization .9b https://ermongroup.github.io/cs228-notes/learning/latent/
The EM algorithm We first describe the algorithm, and will derive the theory later Ch15. Expectation Maximization .9b
An overview of the EM algorithm For example for a 3-Gaussian mixture problem. Given input data x, find aK=1,2,3 , K=1,2,3 , µK=1,2,3 • An initial guess of model parameters, e.g.a 3-Gaussian aK=1,2,3 , K=1,2,3 , µK=1,2,3 • E-step • M-step • Execute 2 through 4 repeated until parameters are stable Ch15. Expectation Maximization .9b
The EM algo. forK-mixture of Gaussians =Conditional expectation E-Step: For each x∈Dx∈D, compute the posterior p(z∣x;θt)p(z∣x;θt). The E-step (expectation): Compute Q(θ; θ (n) ) Will prove them later Ch15. Expectation Maximization .9b http://www.cse.psu.edu/~rtc12/CSE586/lectures/EMLectureFeb3.pdf
Exercise 5 • Estimate means and variances Ch15. Expectation Maximization .9b
Example 1: Test code for 2-Gaussian mixture, em9a.m • function em() %em 1d test demo • %known problem, guess sig needs to be close to ground truth k=2 • %clc clean window commands • clear • close all • clf • thresold=0.01 • N_gt=1000; %total number of samples in total • %sig=[1/sqrt(2), 1/sqrt(2)]'; • old_mean=[0 0 ]' • mean_gt=[4.5 7.8]' %ground truth • %mean=mean_gt+[ -1.25 1.25]'; %initial guess • mean=mean_gt+[ -2 2]'; %initial guess • sig_gt=[1 1]';%ground truth • %sig=sig_gt+[0.1 -0.1]';%initial guess • sig=sig_gt+[0.01 -0.01]';%initial guess • a_gt=[0.4 0.6]'; %sum must be 1 • a=a_gt+[ 0.05 -0.05]';%initial guess • %Generate values from a normal distribution with mean 1 and standard deviation 2: • r1 = (mean_gt(1) + sig_gt(1)*randn(N_gt*a_gt(1),1)); %mean =1, sd =2 • r2 = (mean_gt(2) + sig_gt(2)*randn(N_gt*a_gt(2),1));%mean =3, sd =2.5 • x=[r1;r2]; • max_x=max(x); • min_x=min(x); • figure(3) • clf • subplot(3,1,1); • hist([x;max_x;min_x],50,'FaceColor', 'r')%add max_x;min_x to align 3 plots • ylabel('x') • subplot(3,1,2); • hist([r1;max_x;min_x],50,'FaceColor', 'g')%add max_x;min_x to align 3 plots • ylabel('r1') • subplot(3,1,3); • hist([r2;max_x;min_x],50,'FaceColor', 'b')%add max_x;min_x to align 3 plots • ylabel('r2') • %x=[2,4,7 ]' %overwrite • N=length(x) • for t=1:10 • %%%%%%%%%%% E-step %%%%%%%%%%%%%%%%%%%%% • for n=1:N % • for k=1:2 • g(n,k)=gauss(x(n),sig(k),mean(k)); • end • end • %%%%%%%%%%%%%%%%%% • for n=1:N % • for k=1:2 • raw_w(k,n)=a(k)*g(n,k); • end • end • for n=1:N • denon(1,n)=raw_w(1,n)+raw_w(2,n); • denon(2,n)=raw_w(1,n)+raw_w(2,n); • end • %%%%%%%%%%%%%%%%%%%%%%%%%%%%%%%%%% • %normalize w • for n=1:N • for k=1:2 • w(k,n)=raw_w(k,n)/denon(k,n); • end • end • %%%%%%%%%% M-step %%%%%%%%%%%%%%%%%%%%%%%% • for k=1:2 %find mean • mean(k)=0; • for n=1:N • mean(k)=mean(k)+w(k,n)*(x(n)) ;%new mean, max step • end • mean(k)=mean(k)/sum(w(k,:)); • %%%%%%%%%%%%%%%%%%%%%%%%%%%%%%%%% • sig(k)=0; • for n=1:N • sig(k)=sig(k)+w(k,n)*(x(n)-mean(k))^2 ;%new mean, max step • end • sig(k)=sig(k)/sum(w(k,:)); • a(k)=sum(w(k,:))/N; • end • dd=(old_mean-mean)'*(old_mean-mean) • old_mean=mean; • t • mean • sig • a • dd • 'press key to continue' • pause • if dd<thresold • 'quit, because dd is small enough' • dd • break; • end • end • %plot the Gaussian mixture %%%%%%%%%% • xx=[0:0.1:12]; • %xx=x; • for n=1:length(xx) • temp=0; • for k=1:2 • temp=temp+a(k)*gauss(xx(n),sig(k), mean(k)); • end • gmm_b(n)=temp; • end • %%%%%%%%%%%%%%%%%%%%%%%%%%%%%%%%% • %plot the G1 %%%%%%%%%% • for n=1:length(xx) • temp=0; • k=1; • temp=temp+a(k)*gauss(xx(n),sig(k), mean(k)); • g1_b(n)=temp; • end • %%%%%%%%%%%%%%%%%%%%%%%%%%%%%%%%% • %plot the G1 %%%%%%%%%% • for n=1:length(xx) • temp=0; • k=2; • temp=temp+a(k)*gauss(xx(n),sig(k), mean(k)); • g2_b(n)=temp; • end • %%%%%%%%%%%%%%%%%%%%%%%%%%%%%%%%% • sum(gmm_b)/length(xx) • figure(7) • clf • plot(xx,gmm_b,'k'); • hold on • plot(xx,g1_b,'r'); • hold on • plot(xx,g2_b,'g'); • % 'area' • % area(xx,gmm) • % trapz(xx,gmm) • %%%%%%%%%%%%%%%%%%%%%%%%%%%%%%%%%%%%%%%%%%%%%%%%%%% • function g=gauss(x,sig, mean) • g=(1/sqrt(2*pi*sig^2))*exp(-(x-mean)^2/(2*sig^2)); • return Ch15. Expectation Maximization .9b
Result of the code em8d.m • Input Output Ch15. Expectation Maximization .9b
Example2: Test code:em10a.m • function em() %em 1d test demo • %known problem, guess sig needs to be close to ground truth • %clc clean window commands • clear, close all, clf • thresold=0.0001; • N_gt=10; %total number of samples in total • old_mean=[0 0]'; • mean_gt=[4 7]' ;%ground truth • %mean=mean_gt+[ -1.25 1.25]'; %initial guess • mean=mean_gt+[ -0.2 0.2]'; %initial guess • sig_gt=[1 1]';%ground truth • %sig=sig_gt+[0.1 -0.1]';%initial guess • sig=sig_gt+[0 0]';%fixed sig=stdev , assume there is no need to find sig • a_gt=[0.4 0.6]'; %sum must be 1,prob.that is generated by gaussian [1 or 2] • a=a_gt+[ 0.05 -0.05]';%initial guess • %%%%%gen data if needed • % r1 = (mean_gt(1) + sig_gt(1)*randn(N_gt*a_gt(1),1)); %mean, sd • % r2 = (mean_gt(2) + sig_gt(2)*randn(N_gt*a_gt(2),1));%mean, sd • % x=[r1;r2]; • % x' • %input data,generated by 2Gaussians,G1=(mean=4,stdev=1),G2=(mean=8,stdev=1) • x=[ 5.5344 4.1756 3.5239 3.7203 7.7026 8.2082 6.7524 8.5127 6.2751 6.5347]'; • N=length(x); • 'x=' • x' • for t=1:10 %loop at most 10 times • mean • a • %%%%%%%%%%% E-step %%%%%%%%%%%%%%%%%%%%% • for n=1:N % • for k=1:2 • g(n,k)=gauss(x(n),sig(k),mean(k)); • end • end • %%%%%%%%%%%%%%%%%% • for n=1:N % • for k=1:2 • raw_w(k,n)=a(k)*g(n,k); • end • end • for n=1:N • denon(1,n)=raw_w(1,n)+raw_w(2,n); • denon(2,n)=raw_w(1,n)+raw_w(2,n); • end • %%%%%%%%%%%%%%%%%%%%%%%%%%%%%%%%%% • %normalize w • for n=1:N • for k=1:2 • w(k,n)=raw_w(k,n)/denon(k,n); • end • end • %%%%%%%%%% M-step %%%%%%%%%%%%%%%%%%%%%%%% • for k=1:2 %find mean • %%%%%% mean %%%%%%%%%%%%%%%%%%%%%%%%%% • mean(k)=0; • for n=1:N • mean(k)=mean(k)+w(k,n)*(x(n)) ;%new mean, max step • end • mean(k)=mean(k)/sum(w(k,:)); • % % sig,comment the followings if there is no need to find sig • % sig(k)=0; • % for n=1:N • % sig(k)=sig(k)+w(k,n)*(x(n)-mean(k))^2 ;%new mean, max step • % end • % sig(k)=sig(k)/sum(w(k,:)); • %%%% a %%%%%%%%%%%%%%%%%%%%%%% • a(k)=sum(w(k,:))/N; • end • dd=(old_mean-mean)'*(old_mean-mean); • old_mean=mean; • %sig • t • gg=g'; • gg • w • mean • a • 'press key to continue' • pause • if dd<thresold • 'quit, because dd is small enough' • dd • break; • end • end • %plot the Gaussian mixture %%%%%%%%%% • xx=[0:0.1:12]; • %xx=x; • for n=1:length(xx) • temp=0; • for k=1:2 • temp=temp+a(k)*gauss(xx(n),sig(k), mean(k)); • end • gmm_b(n)=temp; • end • %%%%%%%%%%%%%%%%%%%%%%%%%%%%%%%%% • %plot the G1 %%%%%%%%%% • for n=1:length(xx) • temp=0; • k=1; • temp=temp+a(k)*gauss(xx(n),sig(k), mean(k)); • g1_b(n)=temp; • end • %%%%%%%%%%%%%%%%%%%%%%%%%%%%%%%%% • %plot the G1 %%%%%%%%%% • for n=1:length(xx) • temp=0; • k=2; • temp=temp+a(k)*gauss(xx(n),sig(k), mean(k)); • g2_b(n)=temp; • end • %%%%%%%%%%%%%%%%%%%%%%%%%%%%%%%%% • sum(gmm_b)/length(xx) • figure(7) • clf • plot(xx,gmm_b,'k'); • hold on • plot(xx,g1_b,'r'); • hold on • plot(xx,g2_b,'g'); • % 'area' • % area(xx,gmm) • % trapz(xx,gmm) • %%%%%%%%%%%%%%%%%%%%%%%%%%%%%%%%%%%%%%%%%%%%%%%%%%% • function g=gauss(x,sig, mean) • g=(1/sqrt(2*pi*sig^2)) * exp(-(x-mean)^2/(2*sig^2) ); • return Result obtained by EM: Given ground truth ( 2 Single Gaussian functions, known =[1,1]’): mean_gt(µ_gt)=[4 ,7]; a_gt=[0.4 ,0.6]‘ First guess: mean’ (µ’)=[3.8000, 7.2000]’;a’ =[0.4500, 0.5500]’ Result obtained by EM: mean(µ)=[4.1035,7.1737]’; a =[0.3517,0.6483]’ Ch15. Expectation Maximization .9b
Result • >> em10a • x= • 5.5344 4.1756 3.5239 3.7203 7.7026 8.2082 6.7524 8.5127 6.2751 6.5347 • mean = • 3.8000 • 7.2000 • a = • 0.4500 • 0.5500 • t = 1 • gg = • 0.0887 0.3718 0.3840 0.3977 0.0002 0.0000 0.0051 0.0000 0.0186 0.0095 • 0.0997 0.0041 0.0005 0.0009 0.3516 0.2400 0.3609 0.1685 0.2601 0.3197 • w = • 0.4213 0.9866 0.9985 0.9971 0.0005 0.0001 0.0114 0.0000 0.0554 0.0237 • 0.5787 0.0134 0.0015 0.0029 0.9995 0.9999 0.9886 1.0000 0.9446 0.9763 • mean = • 4.0816 • 7.1751 • a = • 0.3495 • 0.6505 • press key to continue • mean = • 4.0816 • 7.1751 • a = • 0.3495 • 0.6505 • t = 2 • gg = • 0.1389 0.3972 0.3415 0.3737 0.0006 0.0001 0.0113 0.0000 0.0360 0.0197 • 0.1038 0.0044 0.0005 0.0010 0.3471 0.2340 0.3649 0.1631 0.2661 0.3250 • w = • 0.4180 0.9796 0.9972 0.9949 0.0009 0.0002 0.0163 0.0001 0.0677 0.0315 • 0.5820 0.0204 0.0028 0.0051 0.9991 0.9998 0.9837 0.9999 0.9323 0.9685 • mean = • 4.0980 • 7.1718 • a = • 0.3507 • 0.6493 • press key to continue • mean = • 4.0980 • 7.1718 • a = • 0.3507 • 0.6493 • t = 3 • gg = • 0.1422 0.3977 0.3383 0.3715 0.0006 0.0001 0.0118 0.0000 0.0373 0.0205 • 0.1044 0.0045 0.0005 0.0010 0.3465 0.2332 0.3653 0.1624 0.2669 0.3257 • w = • 0.4238 0.9796 0.9972 0.9949 0.0009 0.0002 0.0171 0.0001 0.0702 0.0329 • 0.5762 0.0204 0.0028 0.0051 0.9991 0.9998 0.9829 0.9999 0.9298 0.9671 • mean = • 4.1035 • 7.1737 • a = • 0.3517 • 0.6483 • press key to continue • ans = • quit, because dd is small enough • dd = 3.3746e-05 • ans = 0.0826 Ch15. Expectation Maximization .9b
Example first iteration : E-step • %Given ground truth • %( 2 Single Gaussian functions, known =[1,1]’): • mean_gt(µ_gt)=[4 ,7]; a_gt=[0.4 ,0.6]‘ • >> em10a • x= 5.5344 4.1756 3.5239 3.7203 7.7026 8.2082 6.7524 8.5127 6.2751 6.5347 • mean = 3.8000 7.2000 • a = 0.4500 0.5500 • t = 1 • gg(row=k, column=n)= • 0.0887 0.3718 0.3840 0.3977 0.0002 0.0000 0.0051 0.0000 0.0186 0.0095 • 0.0997 0.0041 0.0005 0.0009 0.3516 0.2400 0.3609 0.1685 0.2601 0.3197 • w (row=k, column=n)= • 0.4213 0.9866 0.9985 0.9971 0.0005 0.0001 0.0114 0.0000 0.0554 0.0237 • 0.5787 0.0134 0.0015 0.0029 0.9995 0.9999 0.9886 1.0000 0.9446 0.9763 • mean = 4.0816 7.1751 • a = 0.3495 0.6505 • ---------------- • W(k=1,n=1)=a1*N(x1| µk=1, k=1)/(a1*N(x1| µk=1, k=1)+a2*N(x1|µk=2, k=2)) • a1*N(x1| µk=1, k=1 )=0.45 *(1/sqrt(2*pi*1^2)) * exp(-(5.5344-3.8)^2/(2*1^2) ) = 0.0398944561 • a2*N(x1| µk=2, k=2 )=0.55* *(1/sqrt(2*pi*1^2)) * exp(-(5.5344-7.2)^2/(2*1^2) )= 0.0548097482 • W(k=1,n=1)=0.0398944561 /( 0.0398944561 + 0.0548097482 )=0.42125327375 • -------------------- • W(k=2,n=1)=a1*N(x1|µk=2, k=2)/(a1*N(x1| µk=1, k=1)+a2*N(x1| µk=2, k=2)) • W(k=2,n=1)= 0.0548097482 /( 0.0398944561 + 0.0548097482 )=0.57874672624 • -------------------- • W(k=1,n=2)=a1*N(x1| µk=1, k=1)/(a1*N(x1| µk=1, k=1)+a2*N(x1| µk=2, k=2)) • a1*N(x1| µk=1, k=1 )=0.45 *(1/sqrt(2*pi*1^2)) * exp(-(4.1756 -3.8)^2/(2*1^2) ) = 0.16729711603 • a2*N(x1| µk=2, k=2 )=0.55* (1/sqrt(2*pi*1^2)) * exp(-(4.1756 -7.2)^2/(2*1^2) )= 0.00226479005 • W(k=1,n=1)= 0.16729711603 /(0.16729711603+ 0.00226479005 )=0.98664328502 • ------------------- • W(k=1,n=2)= 0.00226479005/(0.16729711603 + 0.00226479005 )=0.01335671497 Ch15. Expectation Maximization .9b
Example: first iteration M-step • %input data x, generated by 2Gaussians,G1=(mean=4,stdev=1),G2=(mean=8,stdev=1) • >> em10a • x= 5.5344 4.1756 3.5239 3.7203 7.7026 8.2082 6.7524 8.5127 6.2751 6.5347 • mean = 3.8000 7.2000 • a = 0.4500 0.5500 • t = 1 • w (row=k, column=n) • 0.4213 0.9866 0.9985 0.9971 0.0005 0.0001 0.0114 0.0000 0.0554 0.0237 • 0.5787 0.0134 0.0015 0.0029 0.9995 0.9999 0.9886 1.0000 0.9446 0.9763 • mean = 4.0816 7.1751 • a = 0.3495 0.6505 • Mean(k)=sum_alln(w(k,n)*x(n)/sum_alln(w(k,n)) • Mean(k=1):::::::1111:::::::::::::::: • num1=(5.5344*0.4213+4.1756*0.9866+3.5239*0.9985+3.7203*0.9971+7.7026*0.0005+8.2082* 0.0001+6.7524*0.0114+8.5127*0.0000+6.2751*0.0554+6.5347*0.0237)= 14.26357737 • Den1=(0.4213+0.9866+0.9985+0.9971+0.0005+0.0001+0.0114+0.0000+0.0554+0.0237)=3.4946 • Mean(k=1) =Num1/Den=14.26357737/3.4946=4.08160515367 • Mean(k=2)::::::222::::::::::::::: • num2=5.5344*0.5787+4.1756*0.0134+3.5239*0.0015+3.7203*0.0029+7.7026*0.9995+8.2082*0.9999+6.7524*0.9886+8.5127*1.0000+6.2751*0.9446+6.5347*0.9763=46.67632263 • den2=0.5787+0.0134+0.0015+0.0029+0.9995+0.9999+0.9886+1.0000+0.9446+0.9763=6.5054 • Mean(k=2)=num2/den2=46.67632263/6.5054=7.17501193316 • a(k=1)=den1/N=3.4946/10=0.34946;;;;;;;111;;;;;;;;;;;;;; • a(k=2)=den2/N=6.5054/10=0.65054;;;;;;222;;;;;;;;;;;;;; Ch15. Expectation Maximization .9b
http://ai.stanford.edu/~chuongdo/papers/em_tutorial.pdf Example 3: an EM small numerical example (not Gaussian mixture) • If you know which coin is used, you may find . A=0.8, B=0.45 • (Part b of right hand side) First row • Init.A=0.6, B=0.5 • We perform an exp. 5Heads, 5Tails • ’A =(A)5(1-B)5 • =(0.6)^5*(1-0.6) ^5 • =0.000796 • ’B =(B)5(1-A)5 • =(0.5)^5*(1-0.5) ^5 • =0.0009766 • ’’A = ’A /(’A + ’B) • =0.000796/(0.000796+0.0009766) • =0.4491=0.45 • Similarly, ’’B==0.0009766/(0.000796+0.0009766) • =0.55 https://math.stackexchange.com/questions/25111/how-does-expectation-maximization-work Ch15. Expectation Maximization .9b
EM small numerical example (continue) http://ai.stanford.edu/~chuongdo/papers/em_tutorial.pdf • If you know which coin is used, you may find . A=0.8, B=0.45 • (Part b of right hand side) second row • Init.A=0.6, B=0.5 • We perform an exp. 9Heads, 1Tail • ’A =(A)5(1-A)5 • =(0.6)^9*(1-0.6) ^1 • = 0.00403 • ’B =(B)5(1-B)5 • =(0.5)^9*(1-0.5) ^1 • =0.000976 • ’’A = ’A /(’A + ’B) • =0.00403 /(0.00403 + 0.000976) • =0.8 • Similarly, ’’B= • = 0.000976 /(0.00403 + 0.000976 ) • =0.2 https://math.stackexchange.com/questions/25111/how-does-expectation-maximization-work Ch15. Expectation Maximization .9b
Exercise 6 • Follow up the calculation for the next step Ch15. Expectation Maximization .9b
Derivation of EM Ch15. Expectation Maximization .9b
Math rules • P(B|A)=P(A|B)P(B)/P(A) • P(A and B)=P(A,B)=P(A|B) P(B) • P(A,B|C)=P(A|B,C) P(B|C) • Prove the above as exercises In each cell, the joint probabilityp(r, c) is re-expressed by the equivalent form p(r | c) p(c) from the definition of conditional probability in Equation 5.3. The marginal probability p(r) =Σc*p(r | c*) p(c*), https://www.sciencedirect.com/topics/mathematics/marginal-probability Ch15. Expectation Maximization .9b
The Gaussian mixture model Two views: discrete view(Zn,k), analog view (ak) Each sample xn’ has an one-hot Zk,n’ k=1, ak=1 =Prob. that xn’ is generated by the single Gaussian (µk=1,k=1) • For each sample xn • Discrete View: Zn,k {1 or 0} is a one-hot variable telling which single Gaussian generates xn. • Analog view: You may describe the same structure by using the mixing coefficient ak,0≤ ak≤1. • ak is the soft version of Zn,k describing the same thing. Zn’, k=1=0 Xn’ Zn’,k=2=1 k=2, ak=2 Zn’, k=K,=0 k=K, ak=K Ch15. Expectation Maximization .9b
Example:Two views: discrete view(Zn,k), analog view (ak) • For each Xn, • Table TAB1 for zn,k Show 2 samples xn=1,xn=2 Zn=1,k=1=0 k=1, ak=1 xn=1 Zn=1,k=2=0 Zn=1,k=3=1 k=2, ak=2 Zn=2,k=1=1 For the whole data set ak=1=3/9 ak=2=4/9 ak=3=2/9 xn=2 Zn=2,k=2=0 Zn=2 ,k=3=0 k=3, ak=3 Zk=3 Zk=1 Zk=2 Ch15. Expectation Maximization .9b The set
Graphical view • Data generated by 3 Gaussians k=1,2,3 Cluster K=2 Cluster K=1 Cluster K=3 Ch15. Expectation Maximization .9b
EM Algo.: Gaussian mixture Ch15. Expectation Maximization .9b https://www.cs.toronto.edu/~urtasun/courses/CSC411/13_mog.pdf
EM Algo.: derivation of the ownership weight w() Ch15. Expectation Maximization .9b https://www.cs.toronto.edu/~urtasun/courses/CSC411/13_mog.pdf
Continue Because P(A|B)= P(B|A)*P(A)/P(B) Ch15. Expectation Maximization .9b
Exercise 7: Example using TAB1 Zn,k • X= the set of 9 samples, • Zk={zn=1,k , zn=2,k ,…., zn=N,k}={z1,k , z2,k , z3,k ,…, z9,k} • from TAB1 • P(Zk=2)=(4/9)z1,2*(4/9)z2,2* *(4/9)z3,2*...*(4/9)z9,2 • E.g. P(Zk=2=1)=(4/9)0*(4/9)0*(4/9)1*….*(4/9)0 • P(Zk=2=1)=(4/9) • E.g. if all elements in Z are known , use equation (v) • Mixing coefficients=ak=1=3/9, ak=2=4/9, ak=3=2/9 • P(X)=(3/9)*N(X|µk=1,k=1)+(4/9)*N(X|µk=2,k=2) +(2/9)*N(X|µk=3,k=3) Mixing coefficients= ak=1=3/9, ak=2=4/9, ak=3=2/9 Ch15. Expectation Maximization .9b
Continue Wn,k is an estimation of the probability of the number of elements generated by the k-th Gaussian, it will be used later for derivation Ch15. Expectation Maximization .9b
Continue • Maximum Log_likelihood to find solution Ch15. Expectation Maximization .9b
Informal Proof: Maximum Log-likelihood of mixture parameters, The trick is:Assume akis the guessed solution, so they are known and constant here Only k is considered so the summation is gone Read the tutorial: http://www.cse.cuhk.edu.hk/~khwong/www2/cmsc5707/5707_probability.pptx Ch15. Expectation Maximization .9b Informal Proof: https://stephens999.github.io/fiveMinuteStats/intro_to_em.html
M-step: variance & mixing coefficients • We can get similarity expression for the variance http://jrmeyer.github.io/machinelearning/2017/08/18/mle.html Ch15. Expectation Maximization .9b
Applications with examples of EM Ch15. Expectation Maximization .9b
x • x Ch15. Expectation Maximization .9b https://www.cs.cmu.edu/~roni/10601-slides/EM%20GaussianMixture%20Example.pdf
x • x Ch15. Expectation Maximization .9b
x • x Ch15. Expectation Maximization .9b
Summary Ch15. Expectation Maximization .9b
Alternative proof of EM Ch15. Expectation Maximization .9b
Using d(Log_likelihood [log(L())]/d =0 to find maximum likelihood for k-Gaussian mixture is not working , so use an iteration method. Parameters all_k = [mean =µ,stdev=]all_kDerivation 1 Ch15. Expectation Maximization .9b
Derivation 2 Ch15. Expectation Maximization .9b