Download

1 / 49
490 likes | 519 Views
Learn about simple random samples, cluster and stratified sampling, systematic and multi-stage samples, along with the importance of sampling design and common pitfalls in surveys.

E N D
Producing Data: Samples and Experiments Chapter 5
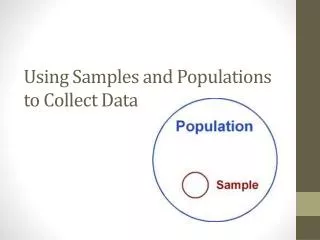
Simple Random Sample • number the population • use a method to randomly select the desired sample size from entire population Advantages: every member of population always has equal chance of being selected Disadvantages: sample may not be representative of population; difficult with large populations
Cluster Random Sample • divide population into clusters • use a method to randomly select one or more clusters • use a method to randomly select from the chosen clusters Advantages: can work well if population is easy to divide or there are established clusters Disadvantages: not everyone has equal chance of being chosen; selected clusters may not be representative of population
Stratified Random Sample • divide population into strata • use a method to randomly select a sample from each strata Advantages: guarantees representation from each strata Disadvantages: not everyone has equal chance of being chosen; strata (of interest) may be difficult to determine; population may be difficult/laborious to sort
Systematic Random Sample • use sample size and population size to determine (estimate) “magic number” • use a method to randomly select number using “magic number” as range; add to determine corresponding selections Advantages: allows rapid method to select from large population; helps provide representation throughout population Disadvantages: not everyone has equal chance of being chosen; sample may not be representative
Multi-Stage Random Sample • use a method (SRS, cluster, stratified) to randomly select (large) groups • use a method (SRS, cluster, stratified to randomly select (smaller) groups • repeat until participants are chosen
Warm up • A sociologist wants to know the opinions of employed adult women about government funding for day care. She obtains a list of the 520 members of a local business and professional women’s club and mails a questionnaire to 100 of these women selected at random. Only 48 questionnaires are returned. What is the population in this study? What is the sample?
Role of Sampling Design • An important goal of statistics is to answer questions using data with some guarantee that the answers are good ones. • An conclusion will be unreliable if the method of collecting data is flawed. • A poor design systematically favors certain outcomes or results and thus provides biased results.
Voluntary Response Design • Suppose the principal is interested in finding out if Southmoore students think more trees should be planted. He makes an announcement and instructs students to come by his office to let him know if tree planting is an issue they support. • Discuss the following: • Will your results provide reliable information? • Define “voluntary response design” on white board.
Voluntary Response continued • A voluntary response sample consists of people who choose themselves by responding to a general appeal. • Voluntary response samples over represent people with strong opinions.
Convenience Sample Design • The principal is surprised to find most of the students coming in his office are in favor of the tree planting. Feeling that maybe his design may not have worked, he ventures into the hallways and starts asking students randomly. • Discuss the following: • Will your results provide reliable information? • Define “convenience sample design” on white board.
Cautions about sample surveys • The following are terms that describe potential problems while taking a sample. • undercoverage • nonresponse • response bias • wording of questions
Cautions about sample surveys • Remember: sample results sometimes simply do not necessarily match the population. • undercoverage • the issue occurs when a sampling design misses a part of the population • nonresponse • the issue occurs when a significant part of the population refuses to participate in the survey
Cautions about sample surveys • response bias • the issue occurs when the person asking the question makes the respondent uncomfortable and possibly influence their answer • wording of questions • the issue occurs when a question is leading and attempts to persuade a respondent toward a particular answer
Identify potential problems • To obtain a sample of households, a television rating service dials numbers taken at random from telephone-directories. • Teen magazine sent a mail-in questionnaire to 500 randomly selected subscribers. One of the questions was the following: “Knowing that the cover price would likely increase, would you prefer the number of advertisements in the magazine to be limited.?”
Identify potential problems • For a survey of student opinions about high school athletic programs, a member of the school board obtains a random sample of students by listing all high school students and using a random number table to select 30 of them. After making phone calls last weekend, she notes six of the students said that they didn’t have time to participate in the survey.
Role of mathematics in sampling • Results will differ from sample to sample. This phenomenon is called sampling variability. • Since we deliberately use chance, the results obey the laws of probability allowing fairly consistent results (within a margin of error). • The degree of accuracy can be improved by increasing the size of the sample.
Designing Experiments: vocab Vocabulary shift from algebra to statistics algebrastatistics • Independent Explanatory variable • Dependent Response variable • Explanatory variable also called a “factor.”
Example for vocabulary check • A corporation found that technology trainings were often stressful to their employees. One idea was to play background music (jazz or classical). Another idea was to have the presenter and participants dress casual rather than the usual business attire. Equivalent technology trainings over the next year were randomly assigned a particular condition. A post training survey was given to measure the stress associated with each training. • Factors? Levels? Treatments?
Example for vocabulary check Factors: music, attire Levels: music (3), attire (2) Treatments: 6
Discussion example 1 • One school board member noticed that students in band tended to be in the top 25% of their school. She compiled a list from each high school’s band director and took a random sample of 25 students from each school’s band. She then took a random sample of 25 students from each high school that wasn’t in band. She found a slightly higher average G.P.A. of student’s in band.
Discussion example 1 • Will this study give evidence that being in band causes an increase in a students G.P.A? • Will this study help her generalize that student’s in band tend to have a slightly higher G.P.A. than students not in band?
Vocabulary from example 1 • Observational study • a study based on data collected from individuals that meet a determined criteria • Lurking variable • an outside factor that is not the explanatory nor response variable • prevents causal relationships from being established in observational studies
Discussion example 2 • Another school board member is surprised the increase is so slight. First, he emails each band director and asks for a list of 30 students. He then accesses each high school’s roster takes the first 40 listed striking any student’s name has already has. He found the average G.P.A. of student’s in band to be more significant than the first study.
Discussion example 2 • Will this study give evidence that being in band causes an increase in a students G.P.A? • Will this study help her generalize that student’s in band tend to have a slightly higher G.P.A. than students not in band?
Discussion example 3 • Walmart is considering buying a gasoline additive that is suppose to improve gas mileage. They found 30 employees in Oklahoma that drive the same car. Fifteen employees are randomly selected to receive the additive, the remaining fifteen are given a bottle with just gas. Each employee is given a set route around the city to drive. The gas mileage is recorded by an onboard computer which shows the additive gives the driver 12% better gas mileage.
Discussion example 3 • Will this study give evidence that using the additive will give a car better gas mileage?
Vocabulary from example 3 • Experiment • a planned study where deliberate conditions are imposed to see how the response variable will change • Confounding variable • a variable associated (noncausal) with the explanatory variable that affects the response variable in some way • makes it difficult to tell if the treatment or the confounding variable affected the response variable significantly
Lurking versus confounding Observation study Experiment ? x y x y ? z z Lurking Confounding
Randomized comparative experiments • Goal of an experiment: collect statistically significant evidence for a cause-and-effect relationship.
An example of a good design? • In order to test the effectiveness of nicotine patches, Dr. Hurt recruited 240 smokers at various locations. Volunteers were to receive a 22-mg nicotine patch for eight weeks. Almost half (46%) of the nicotine group had quit smoking at the end of the study. • Confounding variable: placebo effect
Example • A baby-food producer claims that her product is superior, in that babies gain more weight with her product. For the experiment, 30 healthy babies are randomly selected from a list of 100 volunteers to participate in a 2 week study. • Propose the design of an experiment.
Completely Randomized Design Group 1 15 babies Treatment 1 Her product Compare weight gain Random Allocation Group 2 15 babies Treatment 2 Competitor’s Babies will be numbered 01 to 30. Using a random number table, the first 15 selected will be in Group 1 with the remaining placed in group 2. Each babies’ weight will be measured in pounds and compared.
Principles of Experimental Design • Control: • using comparison ensures that outside factors operate equally on all groups • comparison minimizes effects of confounding variables allowing effects of treatments to be better evaluated • control groups allow us to accurately assess the change in the response variable
Principles of Experimental Design • Control: • Randomization: • use of impersonal chance in order to equalize unanticipated factors so that groups should be similar in all respects. • homogenous groups reduce variability allowing better assessment of treatments
Principles of Experimental Design • Control: • Randomization: • Replication: • perform the experiment on as many subjects to reduce chance variation in the results
Design Example • You are participating in the design of a medical experiment to investigate whether a calcium supplement in the diet will reduce the blood pressure of middle-aged men. Preliminary work suggests that calcium may be effective and that the effect may be greater for African-American men than for white men. • Describe a completely randomized design.
Design example Treatment 1 Calcium Group 1 • What potential problems might be have because we started with random assignment? • How should we alter our experiment? Compare blood pressure Random Assignment Treatment 2 Placebo Group 2
Block Design Completely randomized experiment African American men All participants Completely randomized experiment White men
Group 1 Group 2 Group 3 Group 4 Treatment 1 Calcium Block Design African American men Random assignment Treatment 2 Placebo Compare blood pressure Subjects Treatment 1 Calcium Random assignment White men Treatment 2 Placebo All African American men will be assigned a random number. Half the men who have the smallest numbers will be assigned group 1, the half with the largest numbers will be assigned group 2. The process will repeat for the white men. The reduction in blood pressure will be compared.
Improving the Design • A block is a group of experimental units or subjects that are known before the experiment to be similar in some way that is expected to affect the response to the treatments. • Block design has the same rationale as a stratified random sample. • Blocks allow us to reduce the amount of variation to improve the accuracy of our conclusions by creating homogeneous groups. • single blind versus double blind
Design Example • Is the right hand of a right-handed people generally stronger than the left? Paul Murky of Murky Research designs an experiment to test this question. He fastens an ordinary bathroom scale to a shelf five feet from the floor, with the end of the scale projecting out from the shelf. Subjects squeeze the scale between their thumb and their fingers on the top. The scale reading in pounds measures hand strength. • Is a completely randomized experiment appropriate?
Matched pair Design Group 1 Treatment 2 right hand Treatment 1 left hand Compare difference Random Allocation Group 2 Treatment 2 right hand Treatment 1 left hand A coin will be flipped to decide which hand will be measured first by each participant. Heads will squeeze the left hand first, tails will squeeze the right hand first. The different in the pounds on the scale will be compared.
Improving the Design • In a matched pair design, each subject in the experiment will receive two (and only two) treatments. • The order that each subject receives both treatments is randomly selected to preserve the important aspect of randomization.
Why a simulation? • A simulation is using a model to imitate a chance behavior based on a specific problem situation. • A simulation allows a model to be analyzed when a theoretical probability is unknown or indeterminate.
Elements of a simulation • Number assignment • Description of a trial • Stopping rule • Execution of simulation (marking of the number line) • Documentation of results
Simulation Example • Traffic Lights: Coming to school each day, Anne rides through three traffic lights, A, B, and C. The probability that any one light is green is 0.3, and the probability that it is not green is 0.7. Use a simulation to answer questions below. • We must assume that the lights operate independently. • Estimate the probability that Anne will find all traffic lights to be green. • Estimate the probability that Anne will find at least one light to be not green.
Simulation Example • Number assignment • 0 – 2 green light; 3 – 9 not green • (1 – 3 green light; 4 – 0 not green) • Description of a trial/Stopping rule • A trial consists of choosing one digit at a time to represent one traffic light. After we determine if the light is green or not green, the trial ends after three lights. • Execution of simulation • Documentation of results
Simulation Example 47039 27923 09105 89221 07043 90862 97329 90169 63091 31283 56000 67831 three green lights two or fewer