Download
1 / 14
140 likes | 211 Views
Explore factors influencing portfolio choice and bond markets, including risk, liquidity, information costs, and supply dynamics. Learn how Black Swan events impact diversification and consider interest rate fluctuations. Understand the effects of wealth, risk, inflation, and government policies on bond markets. Gain insights into interest rate changes during economic cycles and fluctuations in response to inflation expectations. Gain clarity on managing bond investments amid changing economic conditions.

E N D
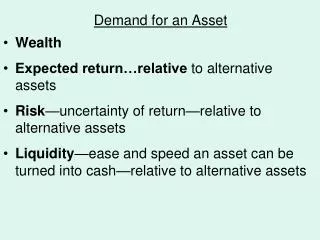
Determinants of portfolio choice (demand for assets) • Rises with saver’s wealth: wealth generally increases demanded for financial assets. 2. Rises with the E(R) (on an asset during a future period) from different investments E(R) = (Event 1 Probability)(Event 1 Value) + (Event 2 Probability)(Event 2 Value) 3. Falls with risk (uncertainty of asset return) in different investmentsRisk averse choose less risky assets (pay to avoid risk) Risk-loving prefer risky assets (possibility of max returns) Risk-neutral decide on the basis of expected returns, ignoring risk. Your time horizon is an important factor in deciding on the degree of risk. 4. Rises with liquidity (increases desire for asset) of different investments 5. Falls with costs of acquiring infoabout different investments (all else equal investors accept a lower return on an asset with lower costs of acquiring info)
Diversification and Fear of the Black Swan! • Diversification divides wealth among less than perfectly positively correlated assets to reduce or eliminate idiosyncratic or asset specific or unsystematic risk. Systematic or market risk, common to all assets in an economy, cannot be diversified. • Some economists see the financial crisis as a black swan – a rare event that has a large impact on the economy – which might affect the conventional measure of risk. • A Wall Street Journal article “Preparing for the Next Black Swan” (August 21, 2010), points out that diversification may not work when there are Black Swan events. • During the financial crisis in late 2008, virtually all assets declined in value at the same time. Instead of relying on only diversification, investors may instead want to make use of various forms of derivatives to prepare for Black Swans. • However, there is no free lunch, since there are costs involved in purchasing derivatives while they may only be exercised on rare occasions.
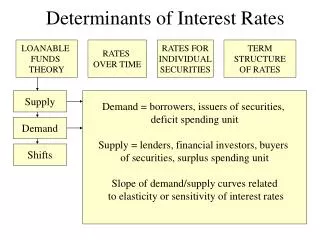
A Demand and Supply for One Year Discount (Zero Coupon) Bond and Change in Quantity Demanded (Supplied) At $960, the quantity of bonds demanded by investors equals the quantity of bonds supplied by borrowers. At any price higher or lower than $960, the quantity of bonds demanded is not equal to the quantity of bonds supplied. The interest rate on the bond is:
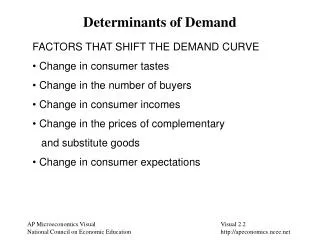
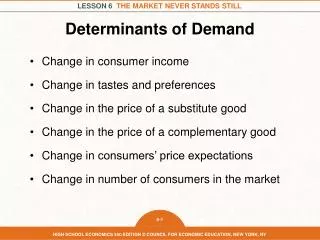
Determinants of Change in Demand for Bonds • Rises with saver’s wealth 2. Rises with the E(R) on bonds 3. Falls withE(R) on other assets 4. Falls with expected inflation 5. Falls with riskiness of bond relative to other assets 6. Rises with liquidity of bond relative to other assets 7. Falls with information cost of bond relative to other assets
Determinants of Change in Supply of Bonds 1. Rises with expected pretax profitability of real investments (firms issue more bonds to finance new projects) 2. Falls with business taxes (lower econ activity requires less bonds) 3. Rises with investment tax credits (government stimulates investments) 4. Rises with expected inflation (lowers real cost of borrowing) 5. Rises with government borrowing (supply curve shifts to the right)Ceteris peribus, a larger government deficit and thus borrowing shifts the bond supply curve to the right, resulting in a higher interest rate. In 2012, bond interest rates remained low despite record deficits. When government runs a deficit, households may anticipate future taxes & increase saving, causing right shift in bonds demand curve. As a result of both curves shifting right, the interest rate would not rise.
The Bond Market Model & Interest Rate Change Explain: The Movement of Interest Rates Over Business Cycle. E.g. Why Do Interest Rates Fall During Recessions? • An economic downturn reduces household wealth and thus decreases the demand for bonds. • The fall in expected profitability reduces lenders’ supply of bonds. • In the new equilibrium (E2), the bond price rises.
The Bond Market Model & Interest Rate Change Explain: How Do Changes in Expected Inflation Affect Interest Rates? The Fisher Effect Higher inflation rates result in higher nominal interest rates, and vice versa. Changes in E(inflation) can cause changes in nominal interest rates before a change in actual inflation occurs. • An increase in expected inflation reduces investors’ expected real return, thus the demand curve for bonds shifts to the left. • The increase in expected inflation increases firms’ willingness to issue bonds, thus the supply curve for bonds shifts to the right. • In the new equilibrium (E2), the bond price falls.
Should You Worry About Falling Bond Prices When the Inflation Rate Is Low? The WSJ claim from 2012: If you buylong term bond yielding 1.5 or 2%, you will lose if inflation goes from 2 to 4%. a. Explain this using graph. b. Suppose that you expect a greater increase in inflation than do other investors, but not until 2015. Should you wait until 2015 to sell your bonds? The nominal interest rate will adjust to changes in E(inflation). Waiting until the nominal interest rate rises would be too late to avoid the capital losses.c. Column suggested long-term bonds would be profitable only with deflation. An unexpected deflation shift the demand for bonds to the right and the supply to the left, increasing the price and return. d. If expected inflation is increasing, would you have made a worse investment if you had invested in long-term bonds than if you had invested in short-term bonds? Higher E(inflation) increases the nominal interest rate, but more on long term bonds, causing them to lose more than short-term bonds.
The Bond Market Model vs The Loanable Funds Model In TheBond Market Model(bonds are treated as the good) and Interest Rate = f(bond’s demand & supply determinants) In The Loanable Funds Model (funds are treated as the good) and Interest Rate = f(changes in the demand and supply of funds). The loanable funds model is more useful in explaining the flow of funds between the US & foreign financial markets than the demand & supply model.In aopen (closed) economy, households, firms, and governments do (not) borrow or lend internationally.
Equilibrium in the Market from the Loanable Funds Perspective At the equilibrium interest rate, the quantity of loanable funds supplied by lenders equals the quantity of loanable funds demanded by borrowers.
Small Open EconomyThe quantity of loanable funds supplied or demanded at homeis too small to affect the world real interest rate. The real interest rate at home and in the international capital market is the same. If the quantity supplied of domesticloanable funds is above (below)the quantity of funds demanded domestically, the country invests (borrow) some of its funds abroad. Determining the Real Interest Rate in a Small Open Economy The domestic real interest rate in a small open economy is the world real interest rate (rw), which is 3% in this case.
Large Open Economy Changes in the demand and supply for loanable funds are large enough to affect the world real interest rate and hence cannot assume that they are equal. Determining the Real Interest Rate in a Large Open Economy The world real interest rate adjusts to equalize desired international borrowing and desired international lending.
Did a Global “Saving Glut” Cause the U.S. Housing Boom? In response to the argument that the Fed’s low-interest-rate policy in the 2000s fueled the housing boom, Ben Bernanke argued that “a significant increase in the global supply of saving—a global saving glut . . . helps to explain . . . the relatively low level of long-term interest rates in the world today.” The world real interest rate is 3%. At that interest rate, the U.S. is borrowing $200 billion from aboard, and the rest of the world is lending $200 billion.