Download
1 / 1
10 likes | 119 Views
Determination of Fluoride in Drinking Water. Dieterich , M.F., Gieseler , M.E., Short, D.B., and Signorelli, R.T. Abstract

E N D
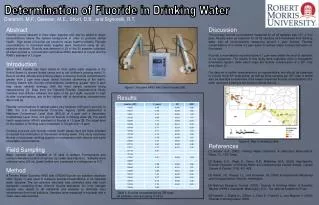
Determination of Fluoridein Drinking Water Dieterich, M.F., Gieseler, M.E., Short, D.B., and Signorelli, R.T. Abstract Fluoride occurs naturally in most water supplies and may be added in larger concentrations above the natural background in order to promote dental health. High levels of fluoride are known to cause health problems. Fluoride concentrations in municipal water supplies were measured using an ion-selective electrode. Fluoride was detected in 23 of the 25 samples collected, all sites reported a concentration well below EPA’s standard of 4 ppm and the WHO’s standard of 1.5 ppm. Introduction Since 1940, fluoride has been added to most public water supplies in the United States to prevent dental caries and to aid children’s growing teeth [1]. Recent studies indicate that drinking waters containing fluoride concentrations greater than 2 ppm may cause dental fluorosis (darkening of the teeth). Drinking waters with fluoride concentrations containing greater than 4 ppm may cause skeletal damage, with the most severe symptom being osteosarcoma [1]. Data from the Harvard Fluoride Osteosarcoma Study indicates that children between the ages of six and eight, exposed to high fluoride concentrations, are at the highest risk of developing osteosarcoma later in life [2]. Fluoride concentrations in natural waters vary between 0.05 and 3 ppm [4]. In 1986, the U.S. Environmental Protection Agency (EPA) established a Maximum Contaminant Level Goal (MGLG) of 4 ppm and a Secondary Contaminant Level (SCL) of 2 ppm for fluoride in drinking water [3]. The world health organization (WHO) standard for fluoride is 1.5 ppm [5].The target level for fluoridation of drinking water is between 0.72 ppm and 1.2 ppm. Growing concerns over fluoride related health issues have led many scholars to request the termination of fluoridated drinking water. This study examines fluoride in local water drinking supplies for comparison with national and world acceptable concentrations. Field Sampling Water samples were collected at 25 sites in western Pennsylvania and northern Maryland located at various zip codes (see Figure 2). Samples were collected using 250 mL plastic bottles and preserved in a refrigerator at 4°C. Method A Thermo Fisher Scientific AR50 with ORION Fluoride ion selective electrode (ISE) (figure 1) was used to measure fluorideconcentrations in all collected water samples. The ion selective electrode was calibrated daily with fresh standards containing three different fluoridestandards. An ionic strength adjuster was added to all standards and samples to eliminate ionic interferences from host solutions. Samples were measured in triplicate and a mean value was reported. Discussion The average fluoride concentration measured for all 25 samples was 0.57 ± 0.04 ppm. Results were as expected for all 25 samples who fluoridated their drinking water with all concentrations measuring around 1 ppm fluoride. Fluorideconcentrations at or below 0.2 ppm seem to indicate water sources that were not fluoridated. Fluoride concentrations recorded below 0.1 ppm were below the level of detection of our equipment. The results of this study were outputted using a Geographic Information System (GIS) which maps the fluoride concentration of a ZIP code area (figure 2). Our data set is neither comprehensive or representative, and should be expanded to include more ZIP code areas, as well as more samples per ZIP code. It would also be desirable to determine if the lowest measured fluoride concentrations (0.2 ppm) represent a background level for natural fluoride. References [1] Hauser, B.A. (2002). Dinking Water Chemistry: A Laboratory Manual.Boca Raton, FL: CRC Press. [2] Bassin, E.B., Wypij, D., Davis, R.B., Mittleman, M.A. (2006). Age-Specific Flouride Exposure in Drinking Water and Osteosarcoma (United States). Cancer Causes & Control, 17(4), 421-428. [3] Artiola, J.F., Pepper, I.L., and Brusseau, M. (2004) Environmental Monitoring and Characterization. Elsevier, Amsterdam. [4] National Research Council. (2006). Flouride In Drinking Water: A Scientific Review of EPA’s Standards. Washington, D.C.: The national Academics Press. [5] Fawwell, J., Bailey, K., Chilton, J., Dahi, E., Fewtrell, L., and Magara, Y. (2006) Fluoride in drinking-water. WHO. Figure1: Accumet AR50 with Orion Fluoride ISE. Results Figure2: Map of sampling sites. Table 1: Fluoride concentrations by ZIP code. All samples collected spring of 2012.