Download
1 / 15
150 likes | 230 Views
Dive into logistic growth models to understand population dynamics and growth rates with insightful examples and practice problems.

E N D
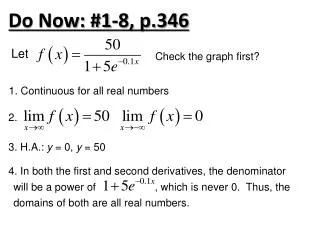
Do Now: #1-8, p.346 Let Check the graph first? 1. Continuous for all real numbers 2. 3. H.A.: y = 0, y = 50 4. In both the first and second derivatives, the denominator will be a power of , which is never 0. Thus, the domains of both are all real numbers.
Do Now: #1-8, p.346 Let Check the graph first? 5. Graph f in [–30, 70] by [–10, 60]. f (x) has no zeros. 6. Graph the first derivative in [–30, 70] by [–0.5, 2]. Inc. interval: Dec. interval: None 7. Graph the second derivative in [–30, 70] by [–0.08, 0.08]. Conc. up: Conc. down: 8. Point of inflection:
Logistic Growth Section 6.5a
Review from last section… Many populations grow at a rate proportional to the size of the population. Thus, for some constant k, Notice that is constant, and is called the relative growth rate. Solution (from Sec. 6.4):
Logistic Growth Models In reality, most populations are limited in growth. The maximum population (M) is the carrying capacity. The relative growth rate is proportional to 1 – (P/M), with positive proportionality constant k: or The solution to this logistic differential equation is called the logistic growth model. (What happens when P exceeds M???)
A national park is known to be capable of supporting no more than 100 grizzly bears. Ten bears are in the park at present. We model the population with a logistic differential eq. with k = 0.1. (a) Draw and describe a slope field for the differential equation. Carrying capacity = M = 100 k = 0.1 Differential Equation: Use your calculator to get the slope field for this equation. (Window: [0, 150] by [0, 150])
A national park is known to be capable of supporting no more than 100 grizzly bears. Ten bears are in the park at present. We model the population with a logistic differential eq. with k = 0.1. (b) Find a logistic growth model P(t) for the population and draw its graph. Differential Equation: Initial Condition: Rewrite Partial Fractions
A national park is known to be capable of supporting no more than 100 grizzly bears. Ten bears are in the park at present. We model the population with a logistic differential eq. with k = 0.1. (b) Find a logistic growth model P(t) for the population and draw its graph. Rewrite Integrate Prop. of Logs
A national park is known to be capable of supporting no more than 100 grizzly bears. Ten bears are in the park at present. We model the population with a logistic differential eq. with k = 0.1. (b) Find a logistic growth model P(t) for the population and draw its graph. Prop. of Logs Exponentiate Rewrite
A national park is known to be capable of supporting no more than 100 grizzly bears. Ten bears are in the park at present. We model the population with a logistic differential eq. with k = 0.1. (b) Find a logistic growth model P(t) for the population and draw its graph. The Model: –c Let A = + e – Solve for P Graph this on top of our slope field! Initial Condition
A national park is known to be capable of supporting no more than 100 grizzly bears. Ten bears are in the park at present. We model the population with a logistic differential eq. with k = 0.1. (c) When will the bear population reach 50? Solve: Note: As illustrated in this example, the solution to the general logistic differential equation is always
More Practice Problems For the population described, (a) write a diff. eq. for the population, (b) find a formula for the population in terms of t, and (c) superimpose the graph of the population function on a slope field for the differential equation. 1. The relative growth rate of Flagstaff is 0.83% and its current population is 60,500. How does the graph look???
More Practice Problems For the population described, (a) write a diff. eq. for the population, (b) find a formula for the population in terms of t, and (c) superimpose the graph of the population function on a slope field for the differential equation. 2. A population of birds follows logistic growth with k = 0.04, carrying capacity of 500, and initial population of 40. How does the graph look???
More Practice Problems The number of students infected by measles in a certain school is given by the formula where t is the number of days after students are first exposed to an infected student. (a) Show that the function is a solution of a logistic differential equation. Identify k and the carrying capacity. This is a logistic growth model with k = 1 and M = 200.
More Practice Problems The number of students infected by measles in a certain school is given by the formula where t is the number of days after students are first exposed to an infected student. (b) Estimate P(0). Explain its meaning in the context of the problem. Initially (t = 0), 1 student has the measles.