Download
1 / 30
300 likes | 313 Views
Explore the effects of Michigan's Small Business and Technology Development Centers on employment growth, industry impact, and revenue generation. Includes projections for future job creation, sales, and tax generation.

E N D
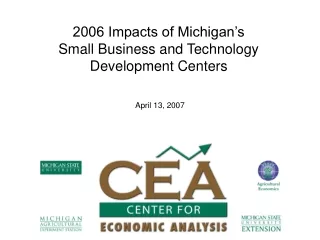
2006 Impacts of Michigan’s Small Business and Technology Development Centers April 13, 2007
2006 Unemployment Rates by County Michigan U.S. 6.91% 4.9% Source: CEA calculations of Bureau of Labor Statistics LAU Series
2006 Unemployment Rates by SBTDC Region Michigan U.S. 6.91% 4.9% Source: CEA calculations of Bureau of Labor Statistics LAU Series
Region’s Growth Exceeds the State Region’s Growth Less than State Relative Growth of Total Employment: 2001 – 2006 SBTDC Region to State Total Source: CEA Calculations and Woods and Poole
Region’s Growth Exceeds the State Region’s Growth Less than State Relative Growth of Total Employment: 2001 – 2006 SBTDC Region to State Total Source: CEA Calculations and Woods and Poole
Region’s Growth Exceeds the State Region’s Growth Less than State Relative Growth of Agricultural Employment: 2001 – 2006 SBTDC Region to State Total Source: CEA Calculations and Woods and Poole
Region’s Growth Exceeds the State Region’s Growth Less than State Relative Growth of Agricultural Services Employment: 2001 – 2006 SBTDC Region to State Total Source: CEA Calculations and Woods and Poole
Region’s Growth Exceeds the State Region’s Growth Less than State Relative Growth of Mining Employment: 2001 – 2006 SBTDC Region to State Total Source: CEA Calculations and Woods and Poole
Region’s Growth Exceeds the State Region’s Growth Less than State Relative Growth of Construction Employment: 2001 – 2006 SBTDC Region to State Total Source: CEA Calculations and Woods and Poole
Region’s Growth Exceeds the State Region’s Growth Less than State Relative Growth of Manufacturing Employment: 2001 – 2006 SBTDC Region to State Total Source: CEA Calculations and Woods and Poole
Region’s Growth Exceeds the State Region’s Growth Less than State Relative Growth of Transportation, Communications and Public Utilities Employment: 2001 – 2006 SBTDC Region to State Total Source: CEA Calculations and Woods and Poole
Region’s Growth Exceeds the State Region’s Growth Less than State Relative Growth of Retail Trade Employment: 2001 – 2006 SBTDC Region to State Total Source: CEA Calculations and Woods and Poole
Region’s Growth Exceeds the State Region’s Growth Less than State Relative Growth of Wholesale Trade Employment: 2001 – 2006 SBTDC Region to State Total Source: CEA Calculations and Woods and Poole
Region’s Growth Exceeds the State Region’s Growth Less than State Relative Growth of Financial Services Employment: 2001 – 2006 SBTDC Region to State Total Source: CEA Calculations and Woods and Poole
Region’s Growth Exceeds the State Region’s Growth Less than State Relative Growth of Services Employment: 2001 – 2006 SBTDC Region to State Total Source: CEA Calculations and Woods and Poole
Percent of Business Establishments Employing Less than 20 Workers Source: CEA Calculations and U.S. Census County Business Patterns 2002
Percent of Business Establishments Employing Less than 20 Workers Source: CEA Calculations and U.S. Census County Business Patterns 2002
Proportion of State Establishments with More than 1000 Employees Source: CEA Calculations and U.S. Census County Business Patterns 2002
Proportion of State Establishments with More than 1000 Employees Source: CEA Calculations and U.S. Census County Business Patterns 2002
MI-SBTDC 2006: Jobs Creation Source: Regional Economic Modeling Inc.
MI-SBTDC 2006: Sales Generation Source: Regional Economic Modeling Inc.
MI-SBTDC 2006: Tax Generation Source: Regional Economic Modeling Inc.
MI-SBTDC 2006 3-Year Projection: Jobs Creation Source: Regional Economic Modeling Inc.
MI-SBTDC 2006 3-Year Projection: Sales Generation Source: Regional Economic Modeling Inc.
MI-SBTDC 2006 3-Year Projection: Tax Generation Source: Regional Economic Modeling Inc.
MI-SPTDC 2006 Budget: Revenue Sources Source: MI-SBTDC
MI-SPTDC 2006 Rate of Return from Budget Sources* Sources: MI-SBTDC, Regional Economic Modeling Inc. * Current prime rate of 8.25% applied to discounting
PowerPoint presentation can be downloaded at, www.cea.msu.edu • For further information, contact